
|
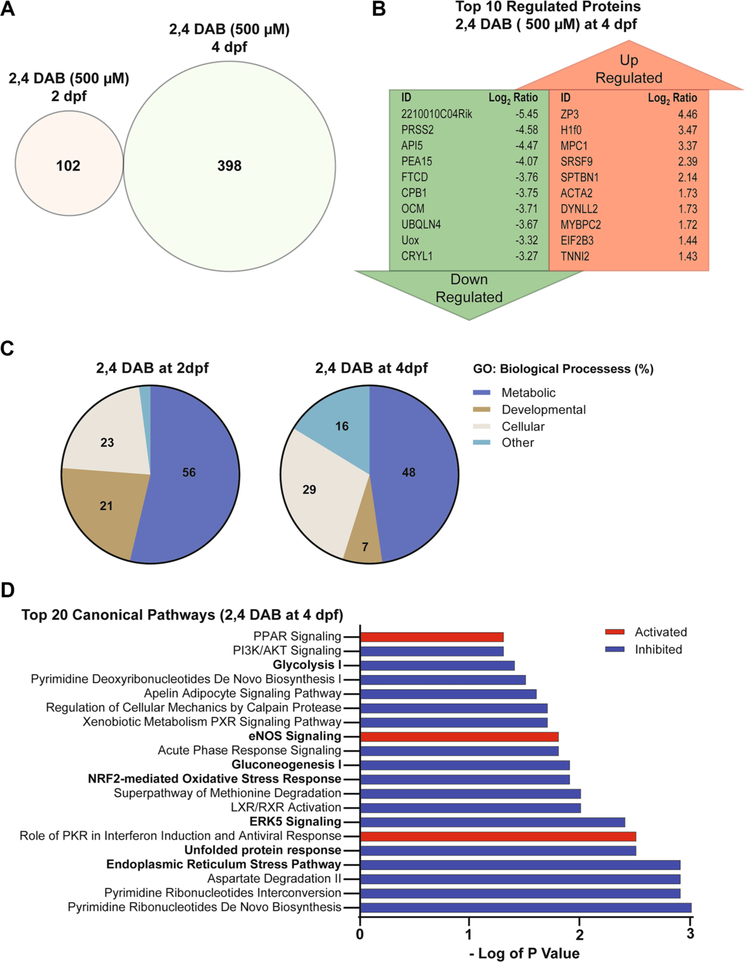
Fig. 6
A Venn diagram shows no overlap in the differentially Expressed Proteins (DEPs) between 2,4-DAB (500 µM) zebrafish larvae exposed groups at 2 dpf (left) and 4 dpf (right). B Top 10 DEPs found to be up or downregulated in the zebrafish larvae groups that were exposed to 2,4-DAB from 6 hpf until 4 days post fertilization (4 dpf). C Pie chart showing the percentage of enriched GO Biological Processes derived from each set DEPs time points: 2- and 4-day post fertilization. D Top 20 canonical pathways found to be activated or inhibited in the zebrafish larvae groups that were exposed to 2,4-DAB until 4 days post fertilization (4 dpf). Red shading indicates predicted activation (z-score > 2), and blue shading indicates predicted inhibition (z-score < − 2). This bar graph width represents enrichment values in the form of minus log of p value that were greater than 1.3