IMAGE

Fig. 5

ID
ZDB-IMAGE-220426-77
Source
Figures for Martin et al., 2022
Image
Figure Caption

Fig. 5

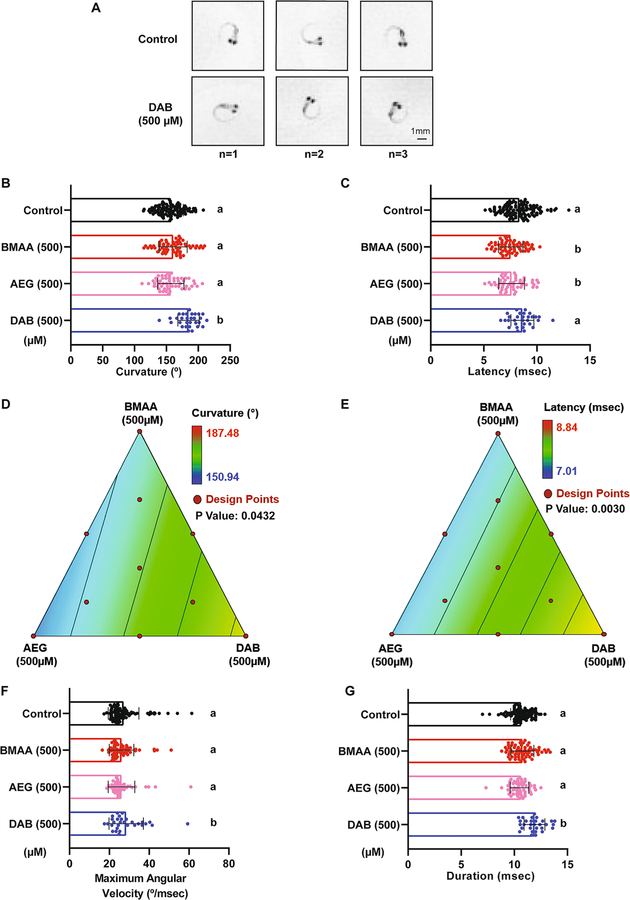
2,4-DAB modulates kinematics of the C startle response. A Three representative images of the peak SLC curvature in 6 days post fertilization (dpf) larvae exposed to vehicle (control, top) and to 2,4-DAB at 500 μM (bottom). B and C Bar graphs quantifying the responses latency and curvature, respectively. D and E 2D contour plot for both the latency and curvature responses at different points in the design space, including each individual cyanotoxin (BMAA, AEG, and 2,4-DAB) and their seven different mixture ratios (Linear regression model, P < 0.05). F and G Bar graphs quantify responses maximum angular velocity and duration, respectively. Levels not connected by the same letter are significantly different (Tukey–Kramer HSD, Alpha 0.05)

Acknowledgments
This image is the copyrighted work of the attributed author or publisher, and ZFIN has permission only to display this image to its users. Additional permissions should be obtained from the applicable author or publisher of the image. Full text @ Neurotox Res