
Image
|
Figure Caption
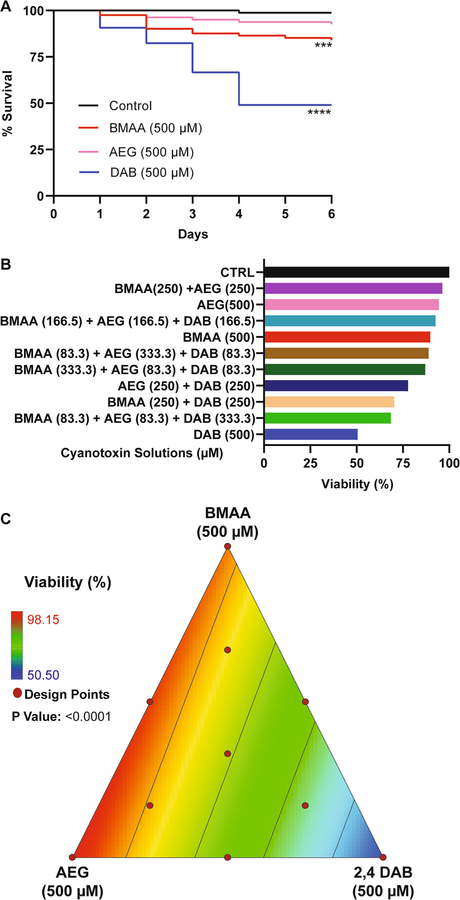
Fig. 2
Viability assessment. A Kaplan–Meier cumulative survival plots comparing percent survival between four treatment groups: Control (n = 108), BMAA (n = 162), AEG (n = 162), and 2,4-DAB (n = 108) (P < 0.001, Mantel-Cox log-rank test). B Bar graph representing percent viability across all treatment groups. C 2D contour plot representing zebrafish percent viability in response to each mixture of BMAA, AEG, and 2,4-DAB (Linear regression model, P < 0.0001)
Acknowledgments
This image is the copyrighted work of the attributed author or publisher, and
ZFIN has permission only to display this image to its users.
Additional permissions should be obtained from the applicable author or publisher of the image.
Full text @ Neurotox Res