
IMAGE
Figure 3
Image
|
Figure Caption
Figure 3
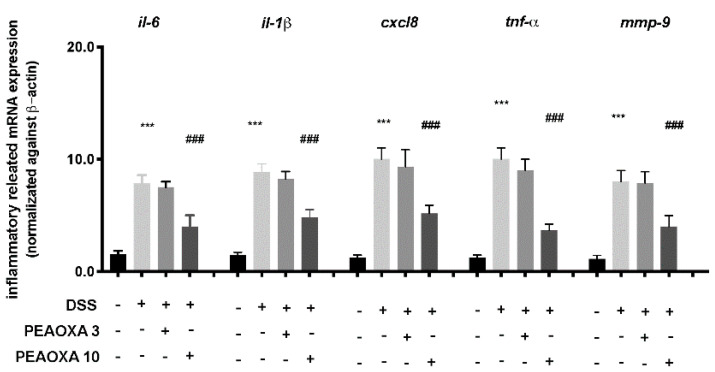
Effect of PEAOXA on mRNA expression of cytokine genes along the zebrafish intestine in presence (+) or absence (-) of DSS and PEAOXA 3 or 10 mg/L exposure. Expression values are normalised against the expression of β-actin mRNA, which was not significantly different between any of the treatment groups. Values represent the mean ± SE *** p < 0.001 compared with CTRL at the same time point and ### p < 0.001 relative to DSS 0.1% group.
Figure Data
Acknowledgments
This image is the copyrighted work of the attributed author or publisher, and
ZFIN has permission only to display this image to its users.
Additional permissions should be obtained from the applicable author or publisher of the image.
Full text @ Life (Basel)