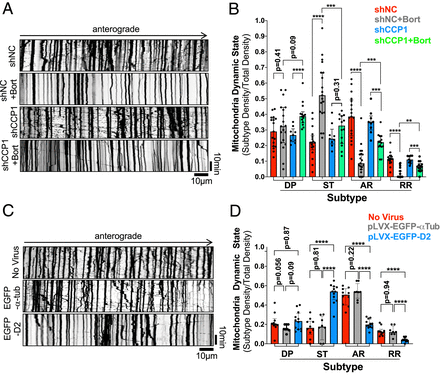
Fig. 7 D2 accumulation is sufficient and necessary to drive defects in mitochondria motility caused by Bort. (A and C) Representative kymographs of mitochondria motility in DRG neurons infected with shCCP1 and shNC lentivirus (A) or pLVX-EGFP-D2 and WT-α-tubulin lentivirus (C) prior to infection with Mito-DsRed lentivirus and Bort treatment (A). Videos, 10 s/frame for 30 min. (B and D) Quantification of mitochondria dynamic state density in neurons treated as in A and C and expressed as a fraction of total mitochondria density. Dynamic Pause (DP); Stationary (ST); Anterograde Running (AR); Retrograde Running (RR). Data shown in B and D are from 9 to 19 (B) or 8 to 12 neurites (B) pooled from three independent experiments. All data in B and D are shown as medians plus interquartile range, and statistics were analyzed by Mann–Whitney U test. **P < 0.01, ***P < 0.001, and ****P < 0.0001.
Image
Figure Caption
Acknowledgments
This image is the copyrighted work of the attributed author or publisher, and
ZFIN has permission only to display this image to its users.
Additional permissions should be obtained from the applicable author or publisher of the image.
Full text @ Proc. Natl. Acad. Sci. USA

