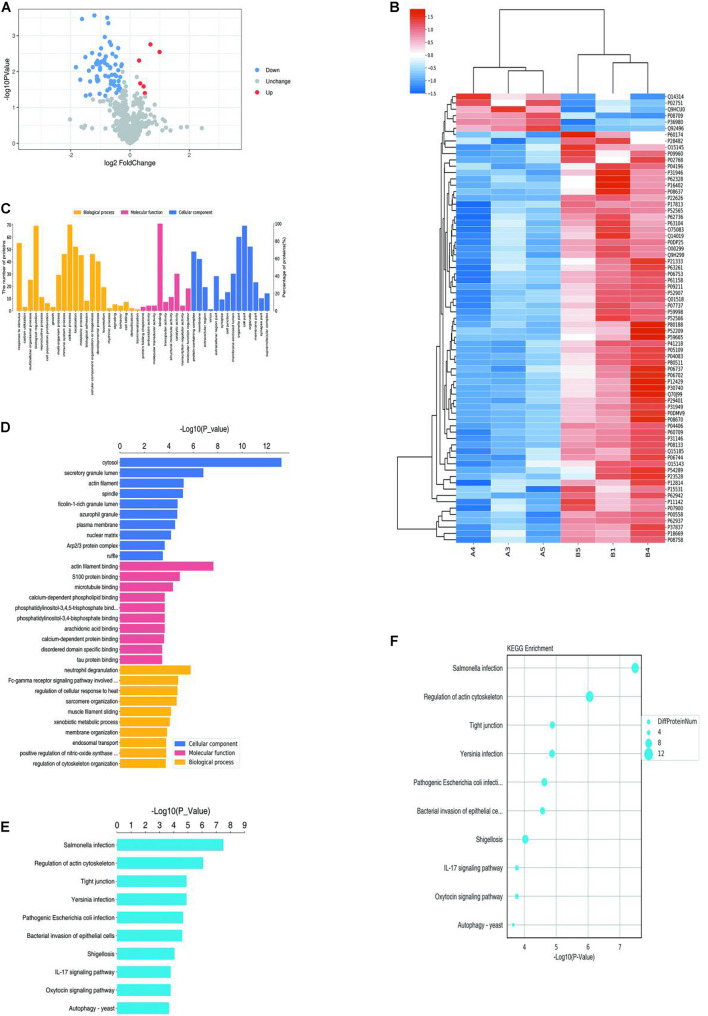
Proteomics and bioinformatics analysis of proteins involved in VM. (A) Volcano plots for the differential expression of proteins between VM and the control group (Red—high expression; blue—low expression). (B) Heatmap for the differential expression of proteins between VM and control group (Red indicates high expression; blue indicates low expression). (C) Gene Ontology (GO) functional annotation analysis of differentially expressed proteins. (D) GO functional enrichment analysis of differentially expressed proteins. (E) KEGG functional enrichment analysis of differentially expressed proteins. (F) KEGG functional enrichment analysis bubble diagram of differentially expressed proteins.
Acknowledgments
This image is the copyrighted work of the attributed author or publisher, and
ZFIN has permission only to display this image to its users.
Additional permissions should be obtained from the applicable author or publisher of the image.
Full text @ Front Cell Dev Biol
Your Input Welcome
Thank you for submitting comments. Your input has been emailed to ZFIN curators who may contact you if
additional information is required.
Oops. Something went wrong. Please try again later.