Figure 4
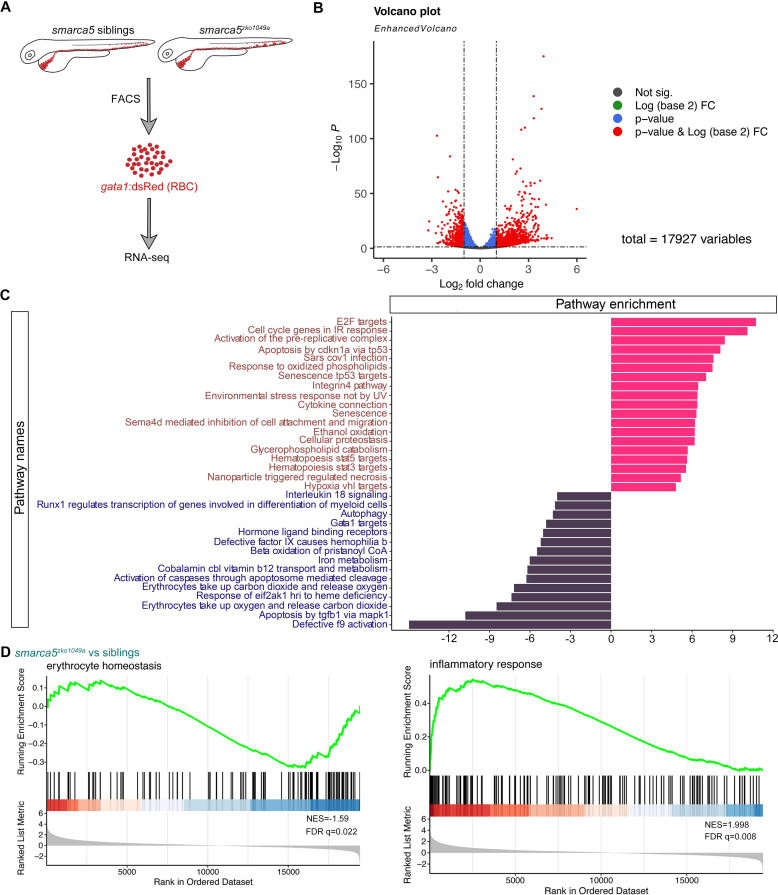
(A) Schematic representation of the RBC RNA-seq workflow in smarca5zko1049a and their siblings at 2 dpf. (B) Volcano plot showing differential expression genes between RBCs from smarca5zko1049a and their siblings by DESeq2. −Log10 P, negative log10 adjusted p-value. Adjusted p-value < 0.05, log2 fold change >1. (C) Differential pathways enriched in RBCs from smarca5zko1049a and their siblings by GSVA. The x axis represents the t values of GSVA scores. Two-sided unpaired limma-moderated t test. (D) Enrichment plots for the top pathways in the mutant RBCs by GSEA (Gene Set Enrichment Analysis).
Transcriptional disruption of genes related to erythrocyte function and homeostasis after smarca5 deletion.
Image
Figure Caption
Figure Data
Acknowledgments
This image is the copyrighted work of the attributed author or publisher, and
ZFIN has permission only to display this image to its users.
Additional permissions should be obtained from the applicable author or publisher of the image.
Full text @ Elife

