
|
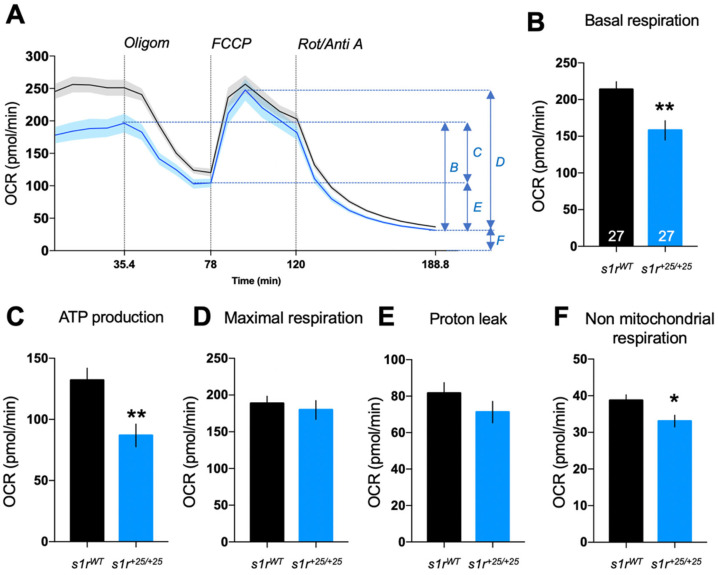
Figure 6 Analysis of mitochondrial respiration by the zebrafish larvae at 5 dpf analyzed using the Seahorse XF mito stress test. (A) Seahorse diagram depicting profile of oxygen consumption rate (OCR) during the assay. Letters (B–F) indicate the OCR components detailed in panels (B–F). (B) Basal respiration, (C) ATP production, (D) maximal respiration, (E) proton leak, (F) non-mitochondrial respiration. Data are shown as mean ± SEM from the number of larvae indicated in (B). Abbreviations: Oligom, oligomycin (25 μM); FCCP, carbonyl cyanide-p-trifluoromethoxyphenylhydrazone (8 μM); Rot/Anti A, rotenone + antimycin A (15 μM). * p < 0.05, ** p < 0.01; unpaired t-test.