IMAGE

Figure 1

ID
ZDB-IMAGE-211025-20
Source
Figures for Cairns et al., 2021
Image
Figure Caption

Figure 1

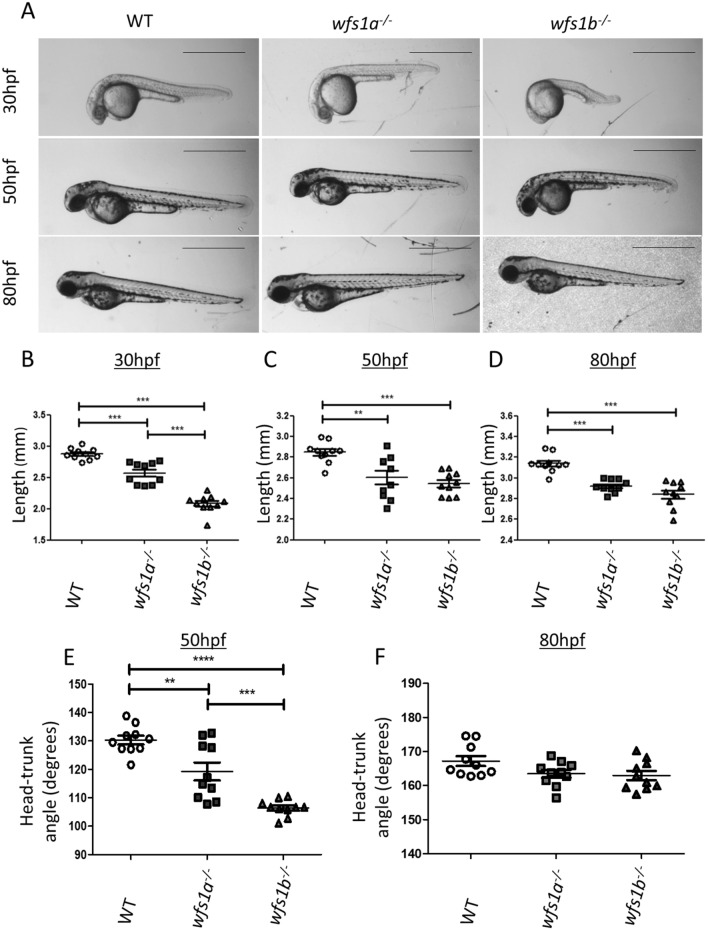
Phenotypic analysis of wfs1a−/− and wfs1b−/− zebrafish. (A) Zebrafish were imaged at 30, 50 and 80 hpf. Scale bars represent 1 mm. (B–D) Zebrafish length at 30 hpf (B), 50 hpf (C) and 80 hpf (D). (E,F) Zebrafish head-trunk angles at 50 hpf (E) and 80 hpf (F). Zebrafish length and head tail angle was measured using ImageJ and data plots represent mean ± SEM (n = 10). Statistical significance was determined by One-Way ANOVA with Bonferroni multiple comparisons. **p < 0.01; ***p < 0.001; hpf hours post-fertilisation, SEM standard error of the mean.

Figure Data
Acknowledgments
This image is the copyrighted work of the attributed author or publisher, and ZFIN has permission only to display this image to its users. Additional permissions should be obtained from the applicable author or publisher of the image. Full text @ Sci. Rep.