IMAGE

Fig. 8.

ID
ZDB-IMAGE-210904-36
Genes
Antibodies
Source
Figures for Lee et al., 2021
Image
Figure Caption

Fig. 8.

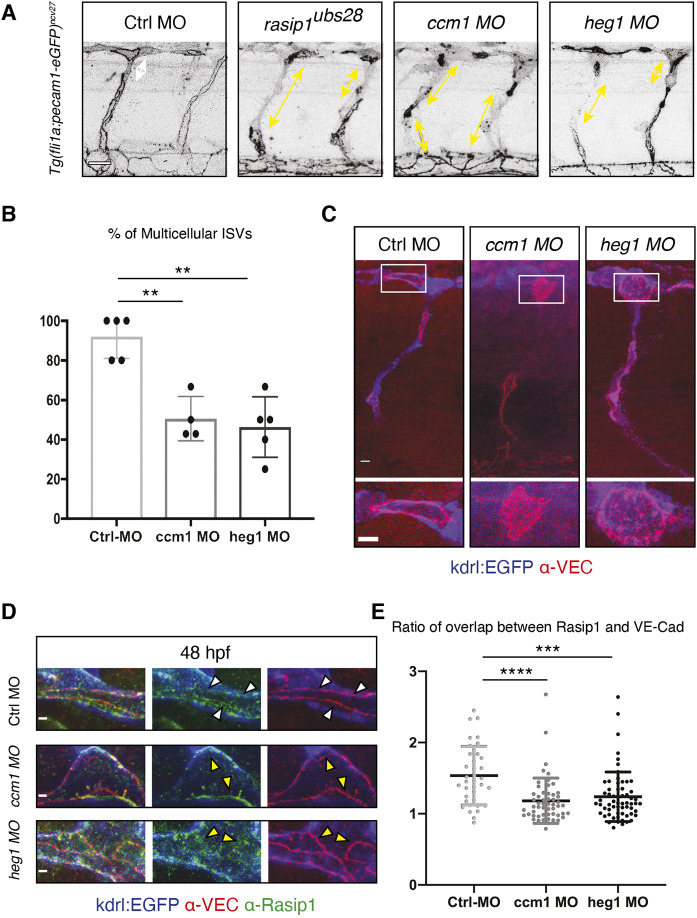
Loss of Ccm1 and Heg1 phenocopies aspects of rasip1 mutants. (A) Defects in cell rearrangements induced by loss of rasip1, ccm1 and heg1 function. Live images at 48 hpf using the Tg(fli1a:Pecam-EGFP)ncv27 reporter line. White and yellow arrows show the gaps between junctions. Scale bar: 20 µm. (B) Quantification of multicellular ISVs at 48 hpf [control (Ctrl) morpholino (MO)-injected embryos n=5, 24 analyzed ISVs; ccm1 MO n=4, 26; heg1 MO n=5, 23]. (C) Immunofluorescence analysis of control, ccm1 and heg1 morphants at 32 hpf. Transgenic Tg(kdrl:EGFP)s843 embryos were stained for VE-cadherin. Boxed areas indicate the regions shown at higher magnification below. Scale bars: 5 μm. (D) Immunofluorescence analysis of control, ccm1 and heg1 morphants using anti-VE-cadherin and anti-Rasip1 antibodies at 48 hpf. Scale bars: 2 µm. White arrowheads indicate colocalization of VE-cadherin and Rasip1. Yellow arrowheads indicate absence of Rasip1 from endothelial cell junctions. (E) Quantification of the relative intensity of Rasip1 localized at junctions compared with that on the apical membrane. Ratio=junctional Rasip1/apical Rasip1 referenced by VE-Cadherin (junction). Control-MO injected embryos display elevated junctional Rasip1 compared with the ccm1 and heg1 morphants (analyzed regions in control MO n=37; ccm1 MO n=54; heg1 MO n=62). Analyzed by unpaired two-tailed Mann–Whitney test (**P<0.01, ***P<0.001, ****P<0.0001); error bars indicate s.d.

Figure Data
Acknowledgments
This image is the copyrighted work of the attributed author or publisher, and ZFIN has permission only to display this image to its users. Additional permissions should be obtained from the applicable author or publisher of the image. Full text @ Development