IMAGE

Fig. 4.

ID
ZDB-IMAGE-210904-25
Genes
Source
Figures for Lee et al., 2021
Image
Figure Caption

Fig. 4.

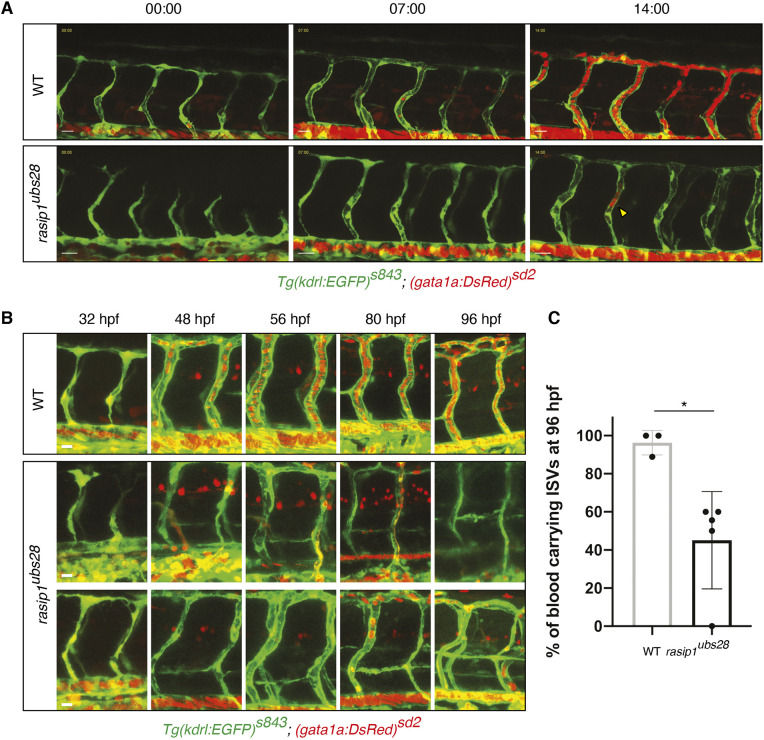
Protracted delays in lumen formation in rasip1 mutants. (A,B) Live images of Tg(kdrl:EGFP)s843; (gata1a:DsRed)sd2 embryos. (A) Still images of time-lapse movies starting at 30 hpf (Movies 7 and 8). (B) Tracking of individual unlumenized ISV during embryonic development (32 to 96 hpf). Scale bars: 20 μm. (C) Percentage of blood-carrying ISVs at 96 hpf (WT n=3 embryos, 28 analyzed ISVs, mutant n=5, 46). Analyzed by unpaired two-tailed Mann–Whitney test (*P<0.1); error bars indicate s.d.

Figure Data
Acknowledgments
This image is the copyrighted work of the attributed author or publisher, and ZFIN has permission only to display this image to its users. Additional permissions should be obtained from the applicable author or publisher of the image. Full text @ Development