
|
Figure 1
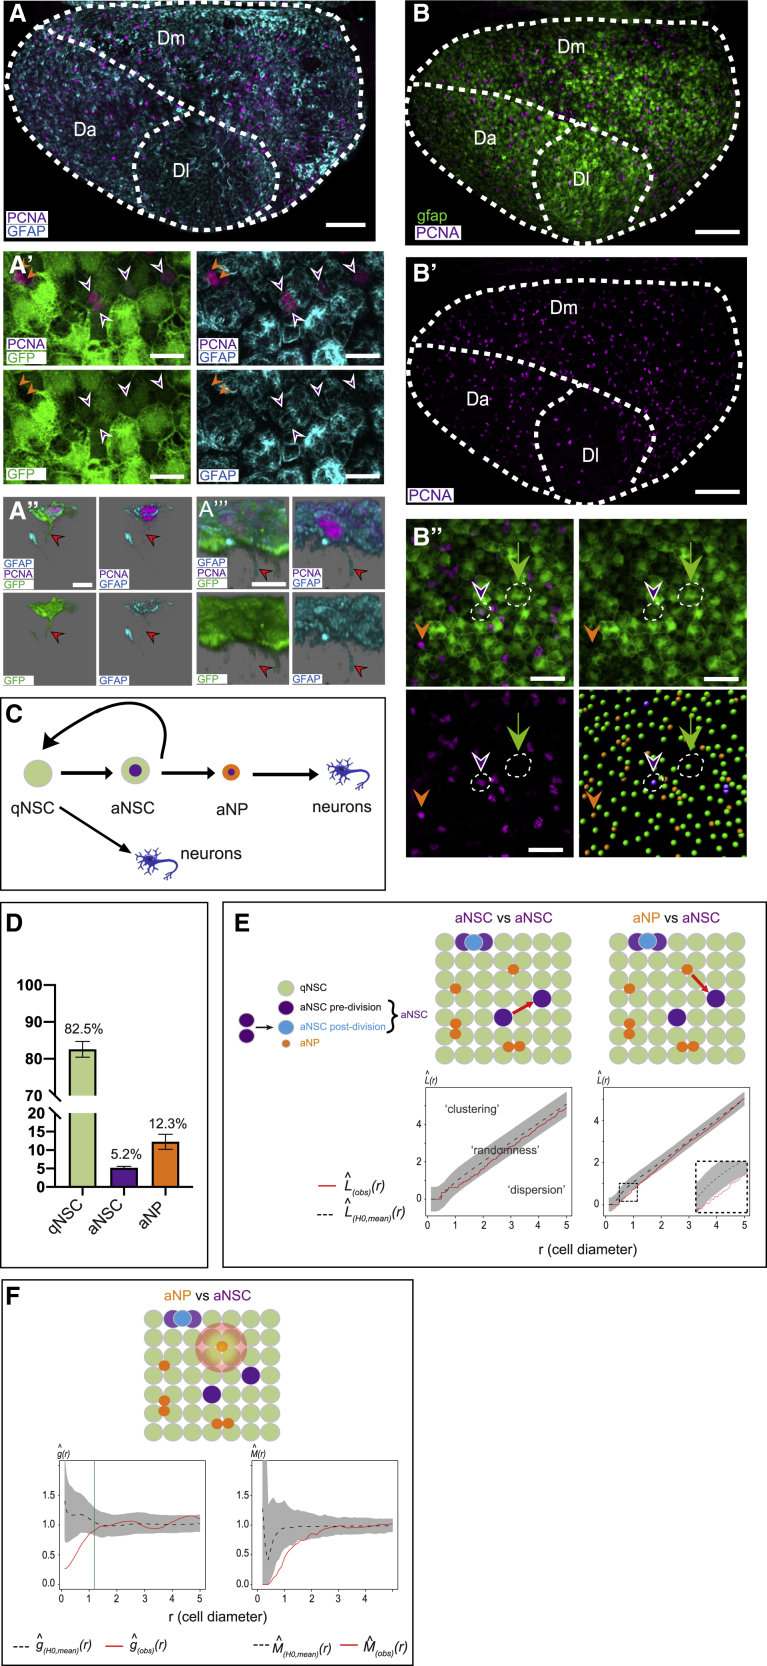
Inhibitory interactions between progenitor cells bias the distribution of NSC activation events
(A–A’’') Confocal dorsal views of a whole-mount adult telencephalon showing the germinal layer of the pallium in a 3mpf
(A and A’) Dorsal (apical) view and high magnification of the NSC layer, showing merged and single channels (color-coded). Arrowheads: purple to aNSCs, orange to aNPs. aNSCs are GFP+,Gfap+, aNPs are negative for both markers.
(A’’ and A’’’) Examples of aNSCs with a process (red arrows) visible using the GFP or the Zrf1 markers, respectively (left and right panels: different backgrounds to ease observation).
(B–B’’) Similar sample stained for GFP (green, NSCs) and PCNA (magenta, proliferating cells).
(B and B’) Merged and single-channel views (color-coded).
(B’’) Close-up in Dm showing progenitor cell states (merged image, individual channels and segmentation): quiescent NSCs (qNSCs; GFP+ only; green), activated NSCs (aNSCs; GFP+,PCNA+; magenta), and proliferating neural progenitors (aNPs; PCNA+ only; orange) (see also
(A, B, and B') Stitches of 4 tiles with 10% overlap.
(C) Main pallial NSC lineage (arrows: lineage transitions).
(D) Proportions of qNSCs, aNSCs, and aNPs relative to each other in Dm (see also
(E) Besag’s
(F) Range and strength of this interaction determined with functions
Scale: (A), (B), and (B’) 100 μm; (A’) 10 μm; (A’’), (A’’’) 7 μm; (B’’) 30 μm.