IMAGE

Fig. 9

ID
ZDB-IMAGE-210712-28
Source
Figures for Buono et al., 2021
Image
Figure Caption

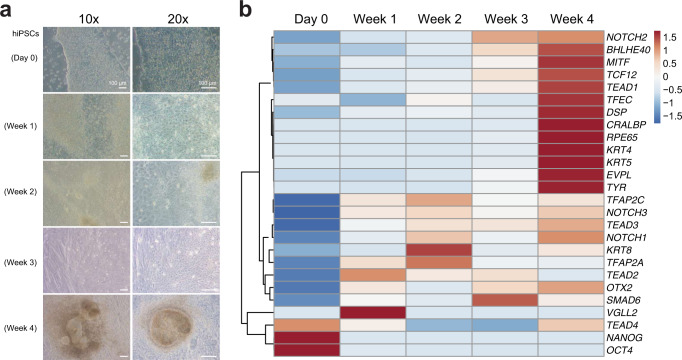
Fig. 9 Gene expression during hiPSCs-to-RPE differentiation.

a Bright field microscopy images (10× and 20×) of hiPSCs before (Day 0) and during their differentiation towards RPE. Note the progressive acquisition of epithelial morphology and pigmentation (observed in three independent experiments). b Hierarchical clustered heatmap showing gene expression level variations, as determined by RT-qPCR during the differentiation towards RPE from hiPSCs. Note the conservation of the two clusters (early and late transcriptional waves) identified in zebrafish.

Acknowledgments
This image is the copyrighted work of the attributed author or publisher, and ZFIN has permission only to display this image to its users. Additional permissions should be obtained from the applicable author or publisher of the image. Full text @ Nat. Commun.