IMAGE

FIGURE 3

ID
ZDB-IMAGE-210526-20
Source
Figures for Grivas et al., 2021
Image
Figure Caption

FIGURE 3

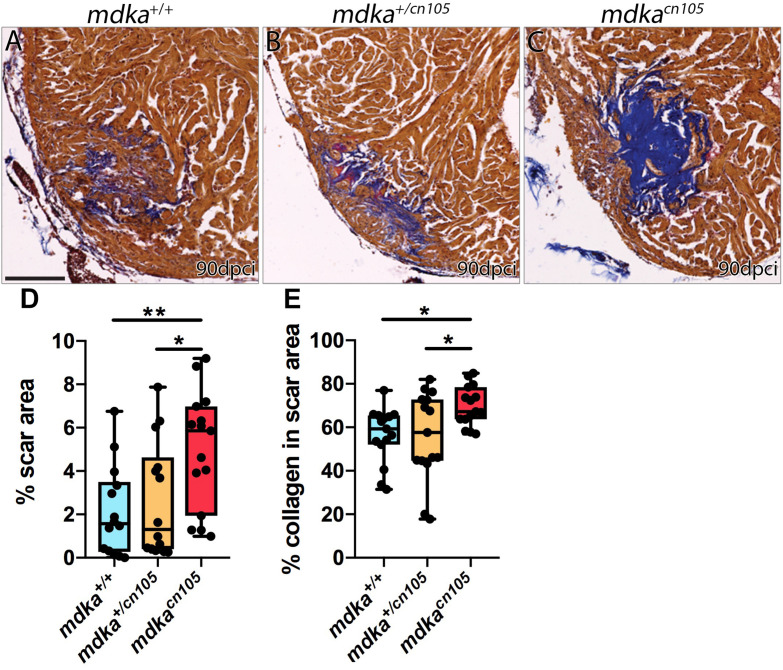
Loss of mdka leads to heart regeneration arrest. (A–C) AFOG staining of 90 dpci mdka+/+, mdka+/cn105, and mdkacn105 hearts. Collagen is shown in blue, fibrin in red, and healthy myocardium in brown. Scale bar, 100 μm. (D) Quantification of the scar area normalized to the total ventricle area. nWT = 14, nKO = 15, nHET = 14. (E) Percentage of collagen in the scar area. nWT = nKO = nHET = 15. Ordinary one-way anova; *P < 0.05; **P < 0.01; Mean ± SD.

Figure Data
Acknowledgments
This image is the copyrighted work of the attributed author or publisher, and ZFIN has permission only to display this image to its users. Additional permissions should be obtained from the applicable author or publisher of the image. Full text @ Front Cell Dev Biol