IMAGE

Figure 4

ID
ZDB-IMAGE-200314-71
Source
Figures for Kang et al., 2020
Image
Figure Caption

Figure 4

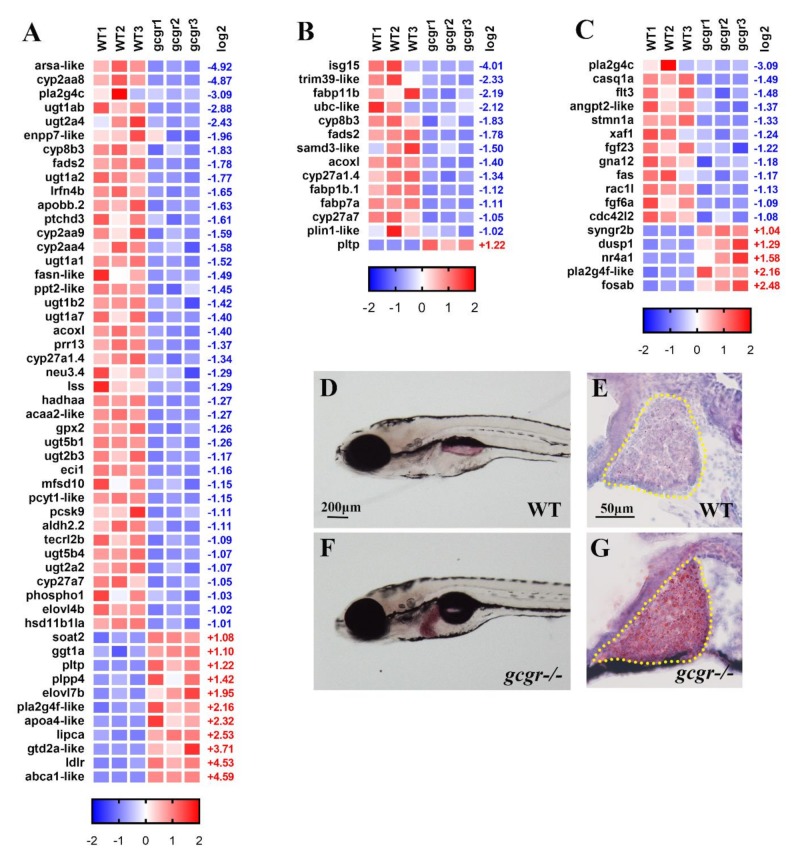
GCGR regulate lipid metabolism in zebrafish larva. (A–C) Heatmaps of transcripts in lipid metabolism enrichment (A) in peroxisome proliferator-activated receptors (PPAR) pathway enrichment (B) and in mitogen-activated protein kinase (MAPK) pathway enrichment (C). Colors represent high (red), low (blue), or average (white) expression values based on Z-score normalized fragments per kilo base per million mapped reads (FPKM) values for each gene. The Z-score indicators are shown under each map. The fold change (log2) are shown on the right. (D–G) Oil Red O (ORO) staining of 7 dpf wildtype (F) and gcgr−/− (G) mutant larvae. Whole-mount ORO staining (D,F) and liver frozen sections ORO staining (E,G) both show accumulation of lipids in the mutant liver. Yellow dash line indicates the liver area.

Figure Data
Acknowledgments
This image is the copyrighted work of the attributed author or publisher, and ZFIN has permission only to display this image to its users. Additional permissions should be obtained from the applicable author or publisher of the image. Full text @ Int. J. Mol. Sci.