Image
Figure Caption

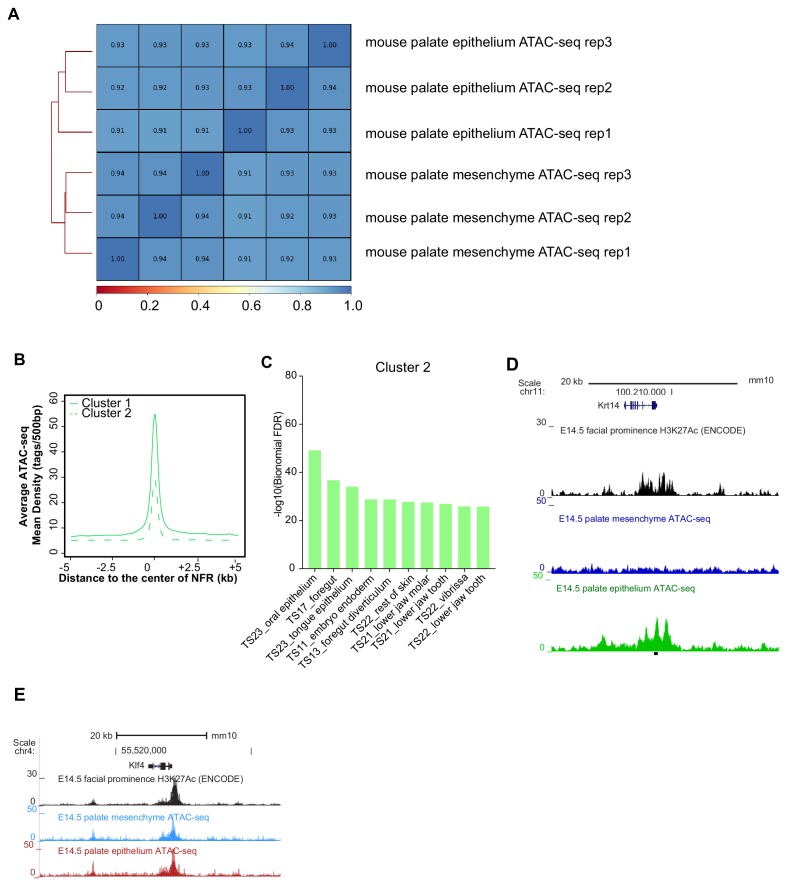
Figure 5—figure supplement 1. Concordance of replicates of mouse embryonic palatal epithelium ATAC-seq.

(A) Correlation of three biological replicates of E14.5 mouse palate epithelium and mesenchyme ATAC-seq results. (B) ATAC-seq density plot of different clusters of E14.5 mouse palate epithelium specific NFRs. (C) GO enrichment (MGI mouse gene expression pattern) of genes associated with cluster 2 elements. (D and E) UCSC Genome browser view showing the ATAC-seq and H3K27Ac ChIP-seq signals in Krt14 and Klf4 locus.

Acknowledgments
This image is the copyrighted work of the attributed author or publisher, and ZFIN has permission only to display this image to its users. Additional permissions should be obtained from the applicable author or publisher of the image. Full text @ Elife