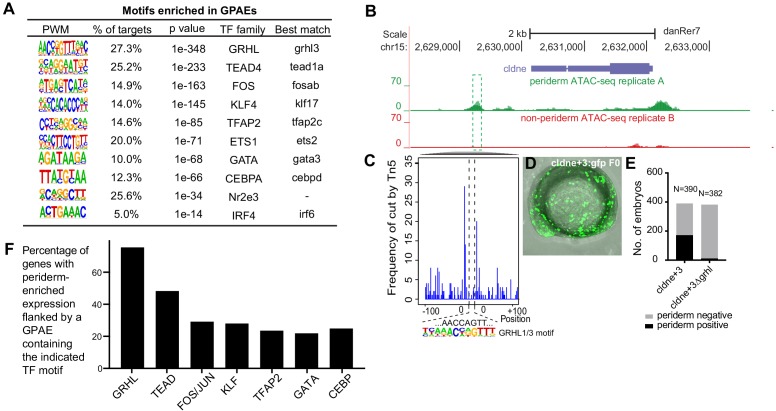
Figure 2 (A) Enriched motifs in zGPAEs. PWM, position weighted matrix. TF, transcription factors. Best match, transcription factor in the indicated family with highest expression in GFP-positive cells, whether or not the expression is enriched in GFP-positive cells in comparison to GFP-negative cells. (B) Genome browser view showing a GFP-positive nucleosome free region (NFR) about 3 kb downstream of the transcription start site of cldne gene. (C) Schematic of frequency of Tn5 cleavage sites at within this NFR, indicating reduced frequency of cleavage at a motif matching the GRHL binding site relative to in flanking DNA. (D) Confocal image of a wild-type embryo at 10 hpf (2-somite stage) injected at the one-cell stage with a reporter construct containing this NFR. (E) Bar chart showing number of embryos positive for GFP signal in the periderm after being injected with the intact reporter or one in which the GRHL motif was deleted. (F) Bar chart showing the percentage of genes whose expression is higher in GFP-positive cells than in GFP-negative cells that are flanked by a zGPAE possessing the indicated binding site.
Image
Figure Caption
Acknowledgments
This image is the copyrighted work of the attributed author or publisher, and
ZFIN has permission only to display this image to its users.
Additional permissions should be obtained from the applicable author or publisher of the image.
Full text @ Elife

