IMAGE

Fig. 4

ID
ZDB-IMAGE-191220-7
Source
Figures for Yang et al., 2019
Image
Figure Caption

Fig. 4

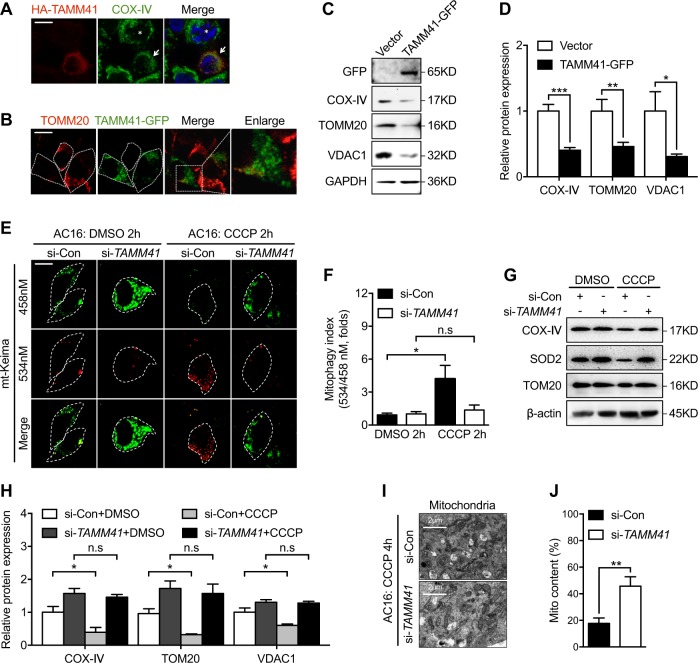
Tamm41 regulates mitophagy progression in AC16 cells. a COS7 cells with HA-TAMM41 (red) overexpression manifest fragmented mitochondrial (COX-IV; green) appearance (white arrowhead) compared with cells without HA-TAMM41 transfection (asterisk). Scale bar: 5 μm. b Immunofluorescence assay shows diminished endogenous mitochondria (TOMM20, red) in TAMM41-GFP overexpressed 293T cells. Scale bar: 5 μm. c, d TAMM41 overexpression reduced mitochondrial protein levels in AC16 cells. e, f Mitophagy activity assessed using mt-Keima in si-control or si-TAMM41 AC16 cells. Elevated levels of mitophagy were observed following CCCP treatment in control AC16 cells, which is not detected in TAMM41 deficient ones. n = 50 cells calculated per group. Scale bar: 5 μm. g, h Western blot analysis reveal compromised CCCP-induced mitochondrial membrane protein elimination ability in TAMM41-deficient cells. i, j TEM (i) and mitochondrial contents calculation (j) show that while mitochondria engulfed by autophagosome (indicated by white arrow) and disappeared after CCCP treatment in si-control AC16 cells, enlarged mitochondria remain abundant (lower panel in i) in TAMM41 deficient AC16 cells. Black horizontal lines indicate mean ± SD. Means ± SD are shown for three independent experiments. n.s, not significant, *P < 0.05; **P < 0.01; ***P < 0.001 (Student’s t-test)

Acknowledgments
This image is the copyrighted work of the attributed author or publisher, and ZFIN has permission only to display this image to its users. Additional permissions should be obtained from the applicable author or publisher of the image. Full text @ Cell Death Differ.