
|
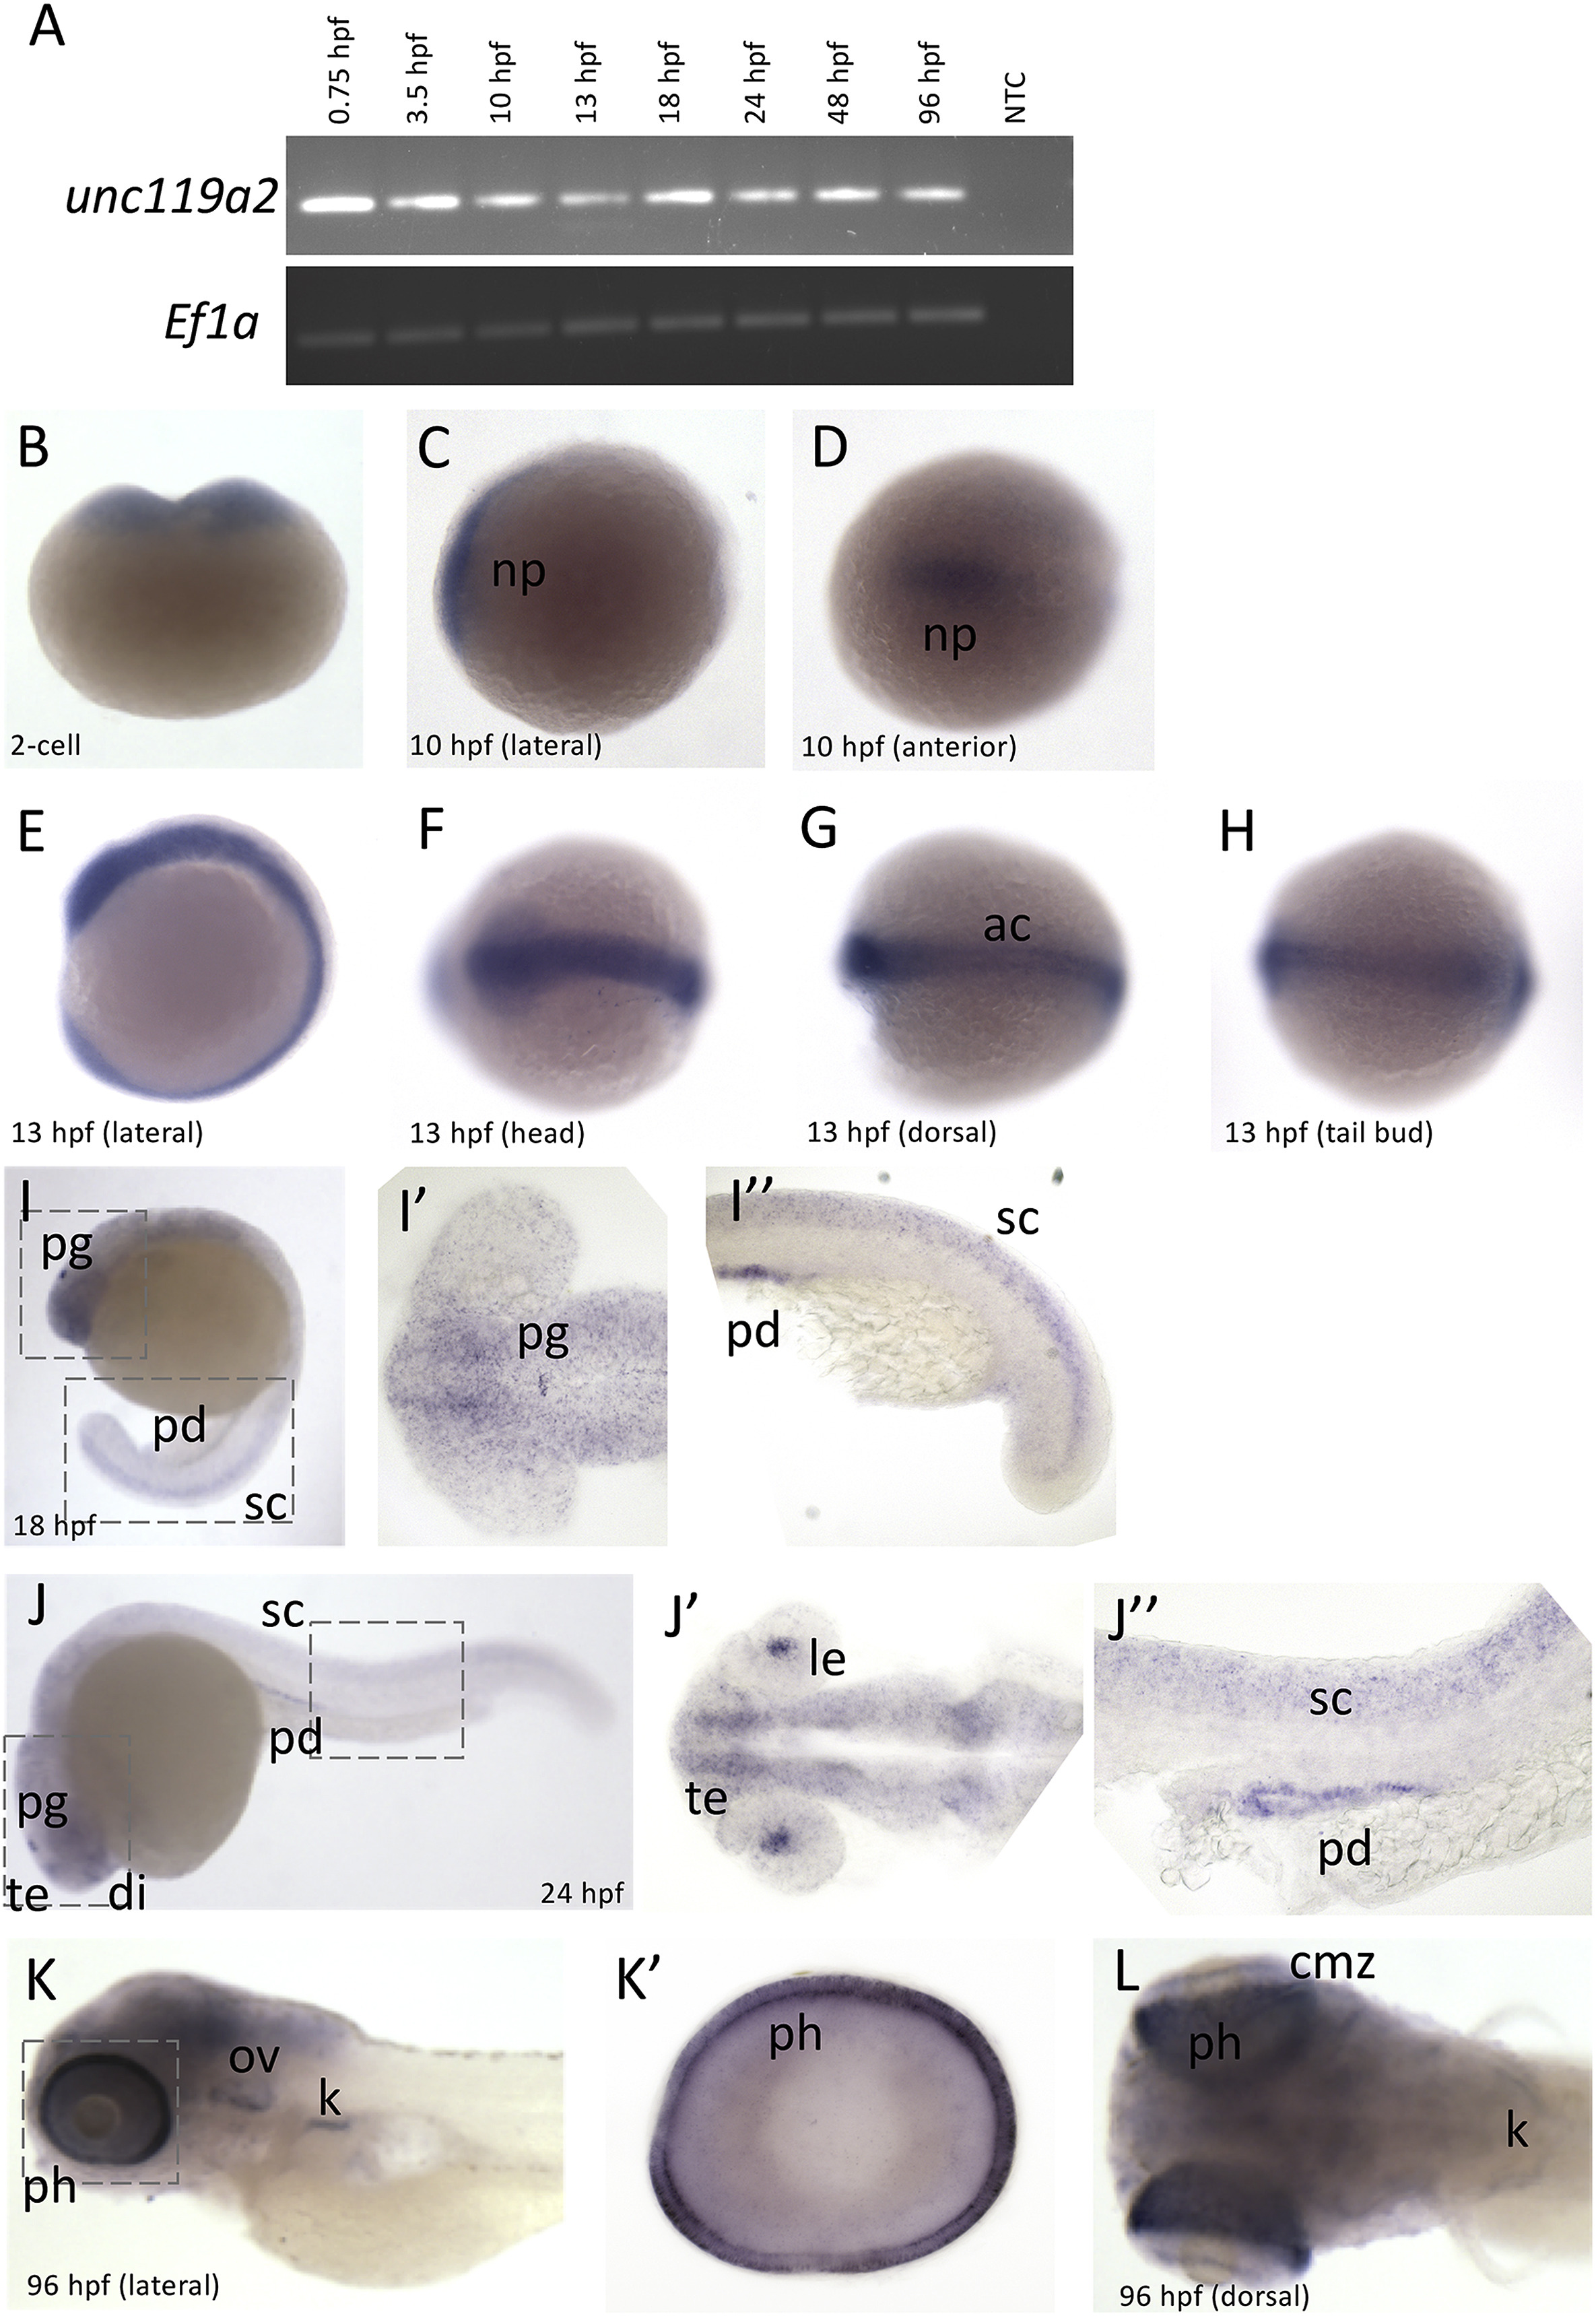
Fig. 5
Temporal and spatial expression of zebrafish unc119a2. A. RT-PCR of unc119bat various embryonic time-points (0.75 hpf (2-cell), 3.5 hpf, 10 hpf, 13 hpf, 18 hpf, 24 hpf, 48 hpf, and 96 hpf) compared to Ef1a. B. 2-cell WISH. C-D. 10 hpf WISH. E-H. 13 hpf WISH. I. 18 hpf WISH. Boxed regions are represented in flatmounts of the head (I′) and tail (I″). J. 24 hpf WISH. Boxed regions are represented in flatmounts of the head (J′) and tail (J″). K. Lateral view of 96 hpf WISH. Boxed region is represented in eye flatmount (K′). L. Dorsal view of 96 hpf WISH embryo. Abbreviations: ac, adaxial cells; cmz, ciliary marginal zone; di: diencephalon; k, kidney; le, lens; np, neural plate; NTC, non-template control; ov, otic vesicle; pd, pronephric duct; pg, pineal gland; ph, photoreceptors; sc, spinal cord; te: telencephalon.
Reprinted from Gene expression patterns : GEP, 33, Jean, F., Pilgrim, D., Evolution and expression of the zebrafish unc119 paralogues indicates a conserved role in cilia, 1-10, Copyright (2019) with permission from Elsevier. Full text @ Gene Expr. Patterns