IMAGE

Figure 1

ID
ZDB-IMAGE-190723-1343
Genes
Source
Figures for Marra et al., 2019
Image
Figure Caption

Figure 1

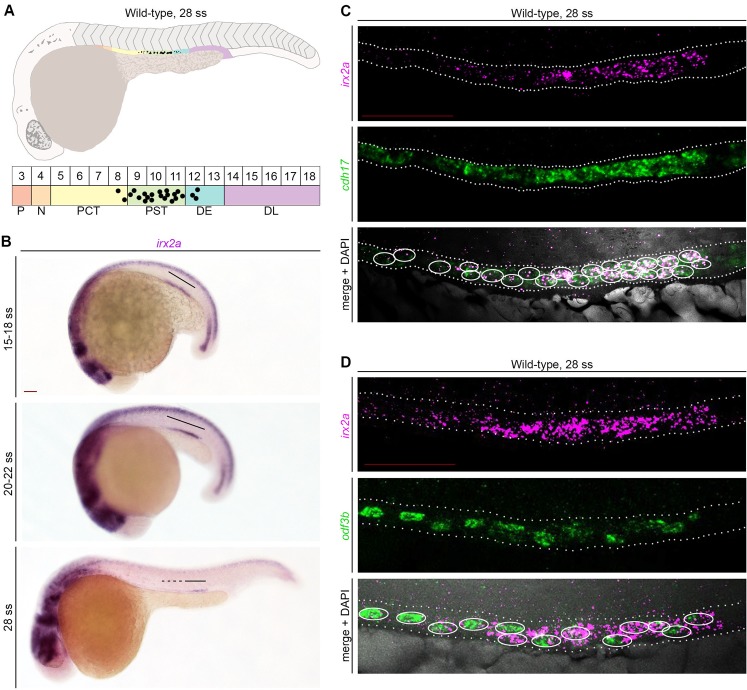
irx2a expression localizes to a region of the zebrafish pronephros that corresponds to the PST, DE and MCC domains. (A) Schematic of a zebrafish embryo (lateral view) at 24 hpf, which is equivalent to the 28 ss. Schematic below depicts color coded segments, corresponding somite numbers, and the expression pattern of MCCs in black within the nephron. MCC number is not to scale. (B) WISH in wild-type zebrafish embryos at the 15–18 ss, 20–22 ss, and 28 ss demonstrates irx2a transcript expression (purple) in the middle of the developing pronephros. Black lines highlight the irx2a expression domain. Scale bar is 50 μm. (C) FISH in wild-type embryos at the 28 ss demonstrates that irx2a expression (magenta) colocalizes with cdh17+ epithelial cells and (D) odf3b+ MCCs of the nephron tubule (green), where DAPI labels the nuclei (grey). Scale bar is 50 μm. White circles indicate nuclei with co-expression of the respective markers. P - podocytes, N - neck, PCT - proximal convoluted tubule, PST - proximal straight tubule, DE - distal early, DL - distal late, MCC - multiciliated cell, ss - somite stage, WISH – whole mount in situ hybridization, FISH – fluorescent in situ hybridization.

Figure Data
Acknowledgments
This image is the copyrighted work of the attributed author or publisher, and ZFIN has permission only to display this image to its users. Additional permissions should be obtained from the applicable author or publisher of the image. Full text @ Sci. Rep.