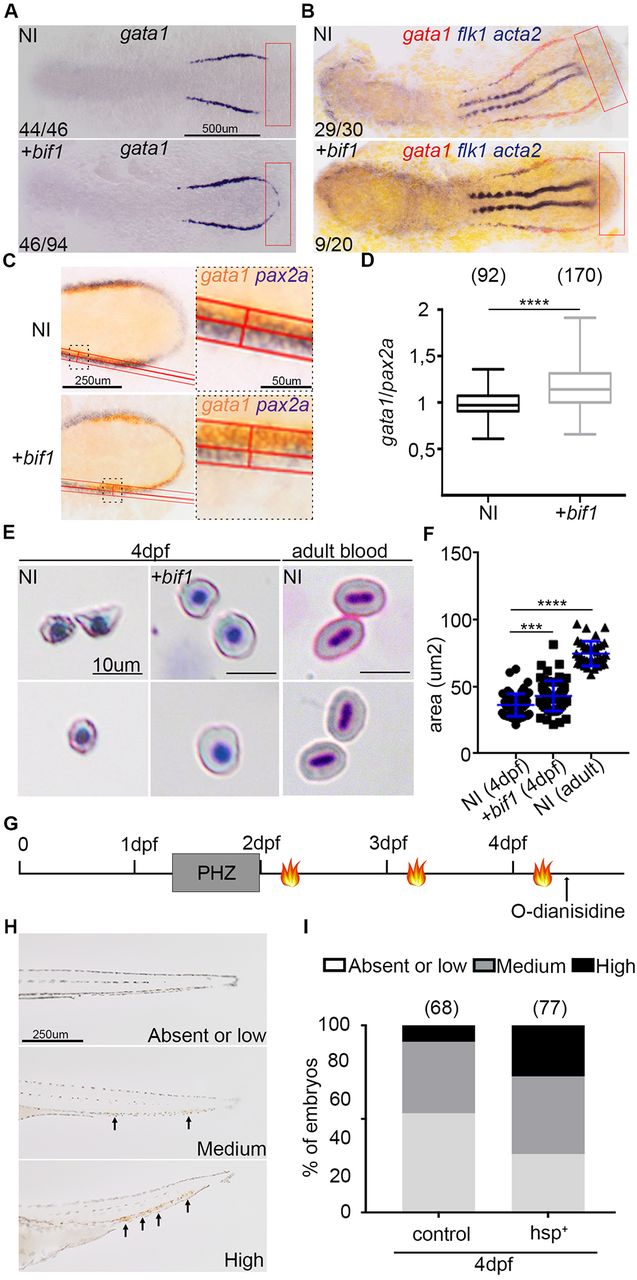
Fig. 3
bif1 affects erythropoiesis. (A) Whole-mount in situ hybridization for gata1 at 12 hpf in non-injected embryos or embryos injected with bif1 mRNA. The red rectangle shows the ectopic region where gata1 is expressed in bif1-injected embryos. (B) Double whole-mount in situhybridization, at 14 hpf, for gata1 (red) and flk1 (blue), a marker of the first angioblasts. (C) Whole-mount in situ hybridization for gata1 (orange) and pax2a (blue) in 12 hpf non-injected embryos or embryos injected with bif1 mRNA. The areas shown at higher magnification are outlined with a dotted rectangle. The red line defines the width of expression for these two stainings. (D) For each embryo, we measured the ratio of gata1 and pax2a width. The lowest and highest points of the whiskers indicate the extreme values. The boxes indicate the 25-75th percentile range. (E) May–Grünwald–Giemsa staining of circulating RBCs, from non-injected embryos or embryos injected with bif1 mRNA at 4 dpf and 6 months, after a cytospin. (F) RBC diameters. The symbols indicate individual data points. (G) Experimental outline of the PHZ-induced anemia followed by three heat shocks at 38°C for 45 min (flames). (H) Bright-field images of tails, indicating the different levels of O-dianisidine staining (arrows). (I) Percentage of embryos showing absent or low (light gray), medium (dark gray) or high (black) levels of hemoglobin, as shown by O-dianisdine staining. Statistical analysis was carried out using an unpaired Student's t-test. Data are mean±s.e.m. ****P<0.0001.

