Fig. 4
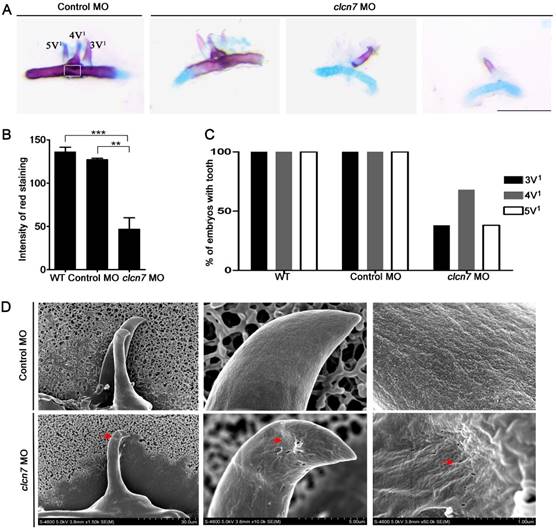
Defective tooth phenotypes in clcn7-deficient zebrafish. (A) Alcian blue and alizarin red staining results of 5thceratobranchial arch and teeth in control and clcn7 morphants at 5dpf. The malformed teeth were fewer with weak red staining clcn7 morphants. (B) Quantitative comparison of the extent of calcification among WT embryos, control and clcn7 morphants. (C) Comparison of embryonic tooth number. WT and control embryos had 3V1, 4V1 and 5V1 teeth, while clcn7 morphants showed 3V1, 4V1 and 5V1 fewer teeth. (D) Ultrastructure of tooth 4V1 in control and clcn7morphants. clcn7 morphants had malformed tooth and enameloid dysplasia. Red arrows point to the pits on the enameloid surface. For A, B, D: WT n=50, Control MO n=50, clcn7 MO n=50. The white square in the first image of figure A is the region for measuring calcified content in panel B. Error bar represents the SD. The experiment was repeated thrice with the same conditions. The data in image C was one of the representative experimental results. WT n=300, Control MO n=320, clcn7 MO n=300. ** p<0.01, *** p<0.001. Scale bars: 100 μm.

