Fig. 2
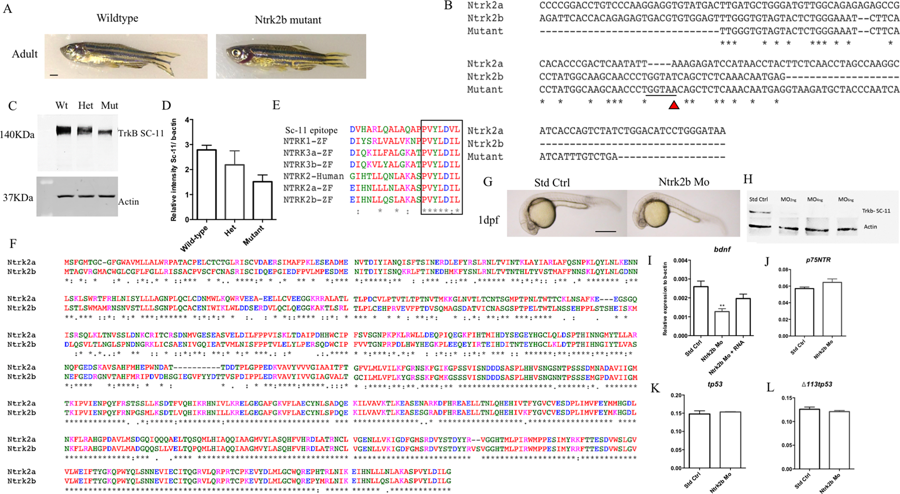
Loss of ntrk2b had no major effect on gross morphology, however the levels of Ntrk protein and bdnf transcript were reduced. (A) Gross phenotypic difference between 6-month old age-matched wild-type and Ntrk2b mutant fish. (B) Ntrk2b exon 17 sequence matched with the mutant sequence suggesting the point mutation causes an abrupt stop codon. (C) Trk protein levels from age-matched adult wild-type, heterozygous and mutant brain samples analyzed using polyclonal anti-Trk antibody. (D) Relative intensity values normalized to actin levels and represented as percentage of control. (E) Amino acid alignment of human and zebrafish Ntrk with polyclonal Trk (SC-11) antibody sequence. (F) Comparative protein sequence analysis of both Ntrk2a and Ntrk2b. (G) Gross morphology of standard control-injected and MO-injected fish at 24 hours post injection. (H) Trk and actin western blots of 2 dpf old MO injected samples of different doses. (I) The bdnf transcript levels in the ntrk2b morphant are significantly reduced. (J) The p75ntr transcript levels in the morphant are unchanged. (K) tp53 levels are unchanged in the morphant. (L) A tp53 isoform delta 113 transcript is unaltered in the morphant. The y-axis for the Q-RT PCR represents relative expression levels normalized to b-actin. (Bars represent Mean ± SEM, **p = 0.0029, ***p = 0,0002, one-way ANOVA.Scale bar = 100 µm).

