
Fig. 5
|
Fig. 5
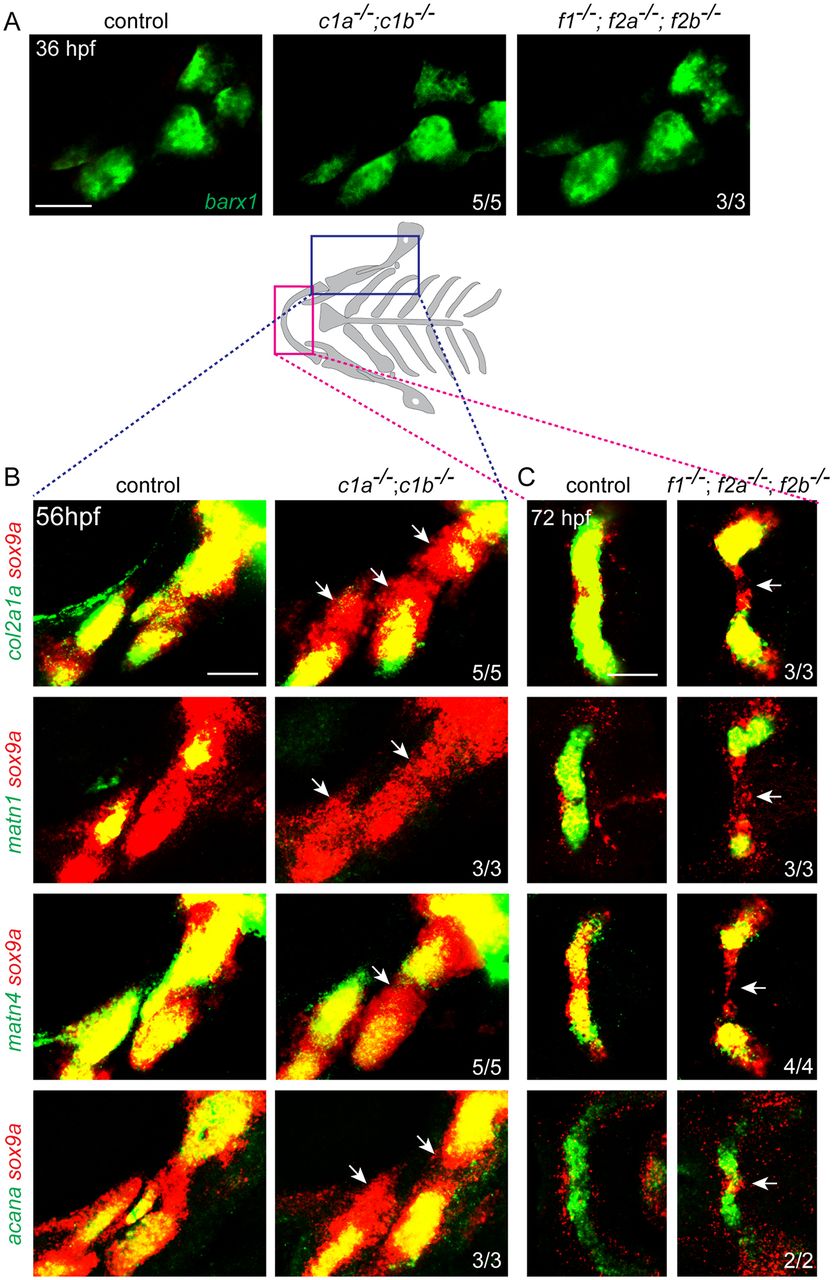
Fox genes are required for chondrogenic gene expression downstream of Sox9a. (A) Fluorescence in situ hybridizations show that barx1+ pre-cartilage condensations of the first two arches are unaltered in foxc1a; foxc1b double mutants (c1a−/−; c1b−/−) and foxf1; foxf2a; foxf2b triple mutants (f1−/−; f2a−/−; f2b−/−) compared with sibling controls. (B,C) Schematic of the cartilaginous facial skeleton shows regions examined by fluorescence in situ hybridization. Maximum intensity projections for foxc1a; foxc1b mutants at 56 hpf (B) and representative sections for foxf1; foxf2a; foxf2b mutants at 72 hpf (C) show expression of the chondrogenic genes col2a1a, matn1, matn4 or acana (green) relative to sox9a (red). Arrows indicate regions in which sox9a+ cells have reduced chondrogenic gene expression relative to sibling controls. Numbers denote proportions of embryos with displayed patterns. Scale bars: 50 μm.