
Fig. 4
|
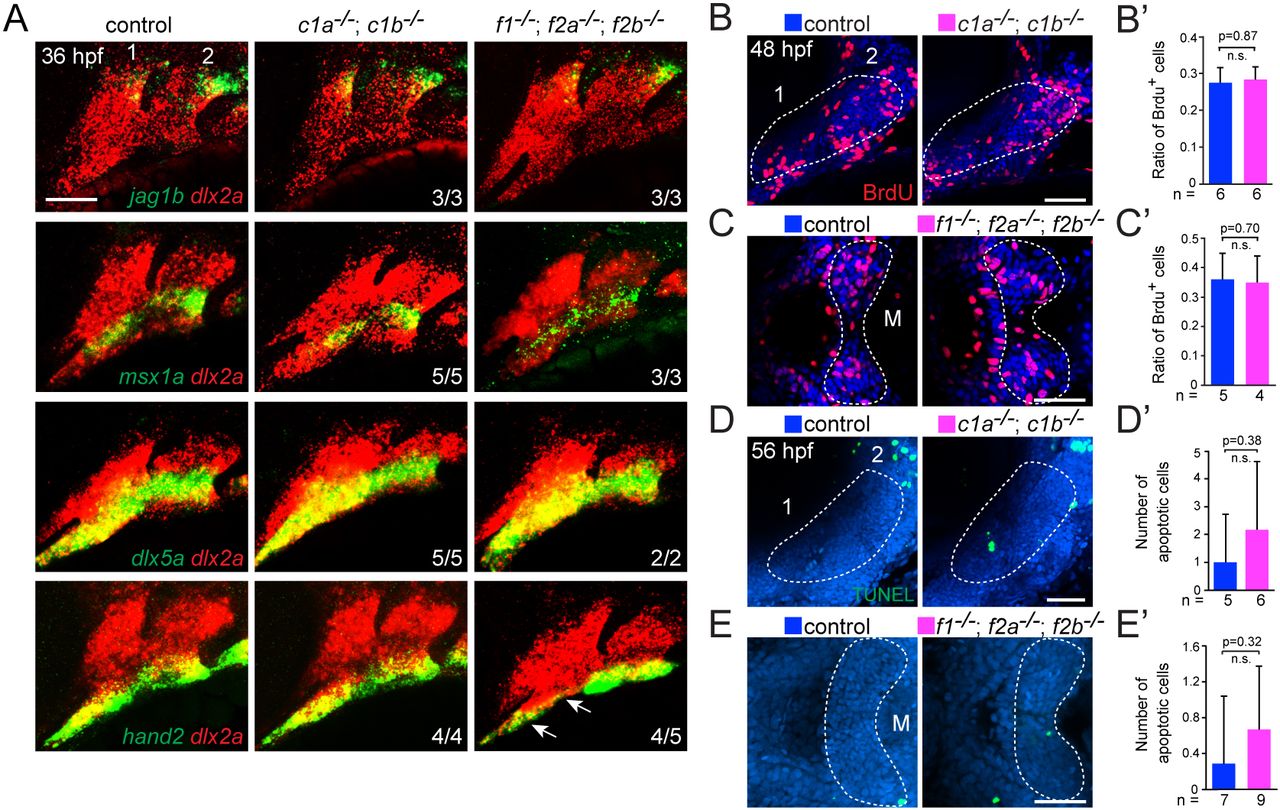
Fig. 4
Dorsoventral gene expression, proliferation and apoptosis in Fox mutants. (A) Fluorescence in situ hybridizations of the first two arches (numbered) show expression of jag1b (dorsal), msx1a and dlx5a (intermediate), or hand2 (ventral) in green relative to dlx2a+ arch CNCs in red. Expression is largely unaffected in foxc1a; foxc1b double mutants (c1a−/−; c1b−/−) and foxf1; foxf2a; foxf2b triple mutants (f1−/−; f2a−/−; f2b−/−) compared with sibling controls, with the exception of reduced hand2 in the ventral first arch of foxf1; foxf2a; foxf2b triple mutants (arrows). (B-C′) Analysis of proliferation. Confocal sections show BrdU+ cells (red) compared with all nuclei (Hoechst, blue) in lateral views of the first two arches (numbered) of foxc1a−/−; foxc1b−/− embryos and ventral views of the first arch Meckel's cartilage domains (M) of foxf1−/−; foxf2a−/−; foxf2b−/− embryos, relative to sibling controls. Dashed lines represent the regions quantified in the accompanying graphs. (D-E′) Analysis of apoptosis. Maximum intensity projections show the number of TUNEL+ cells (green) in lateral views of the first two arches (numbered) of foxc1a−/−; foxc1b−/− embryos and ventral views of the first arch M cartilage domains of foxf1−/−; foxf2a−/−; foxf2b−/− embryos, relative to sibling controls. Dashed lines represent the regions quantified in the accompanying graphs. Error bars represent s.e.m. Scale bars: 50 μm. n.s., not significant.