
|
Fig. S4
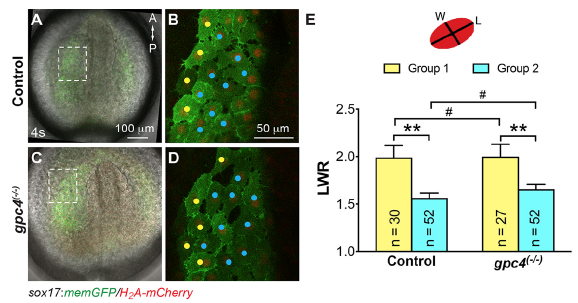
Morphology of anterior endodermal cells is not affected in gpc4 mutants.
(A,C) Overlay of bright-field and epifluorescence images of Tg(sox17:memGFP/H2A-mcherry) embryos at 4s. Dashed boxes are regions in which cells were imaged for analysis of shape. (B, D) Confocal images of the endoderm at the region indicated in the dashed boxes in A, C. Endodermal cells at the lateral region and near the dorsal midline are labeled with yellow and cyan dots, respectively. A, anterior; P, posterior. (E) Schematic representation of the method used to measure cell shape (LWR, length-to-width ratio). Quantification of LWR of endodermal cells in seven control and six gpc4 mutant embryos. Bars represent the mean±s.e.m. The number of cells analyzed is indicated. #, p>0.05; **, P<0.01, student’s t-test.