Fig. 1
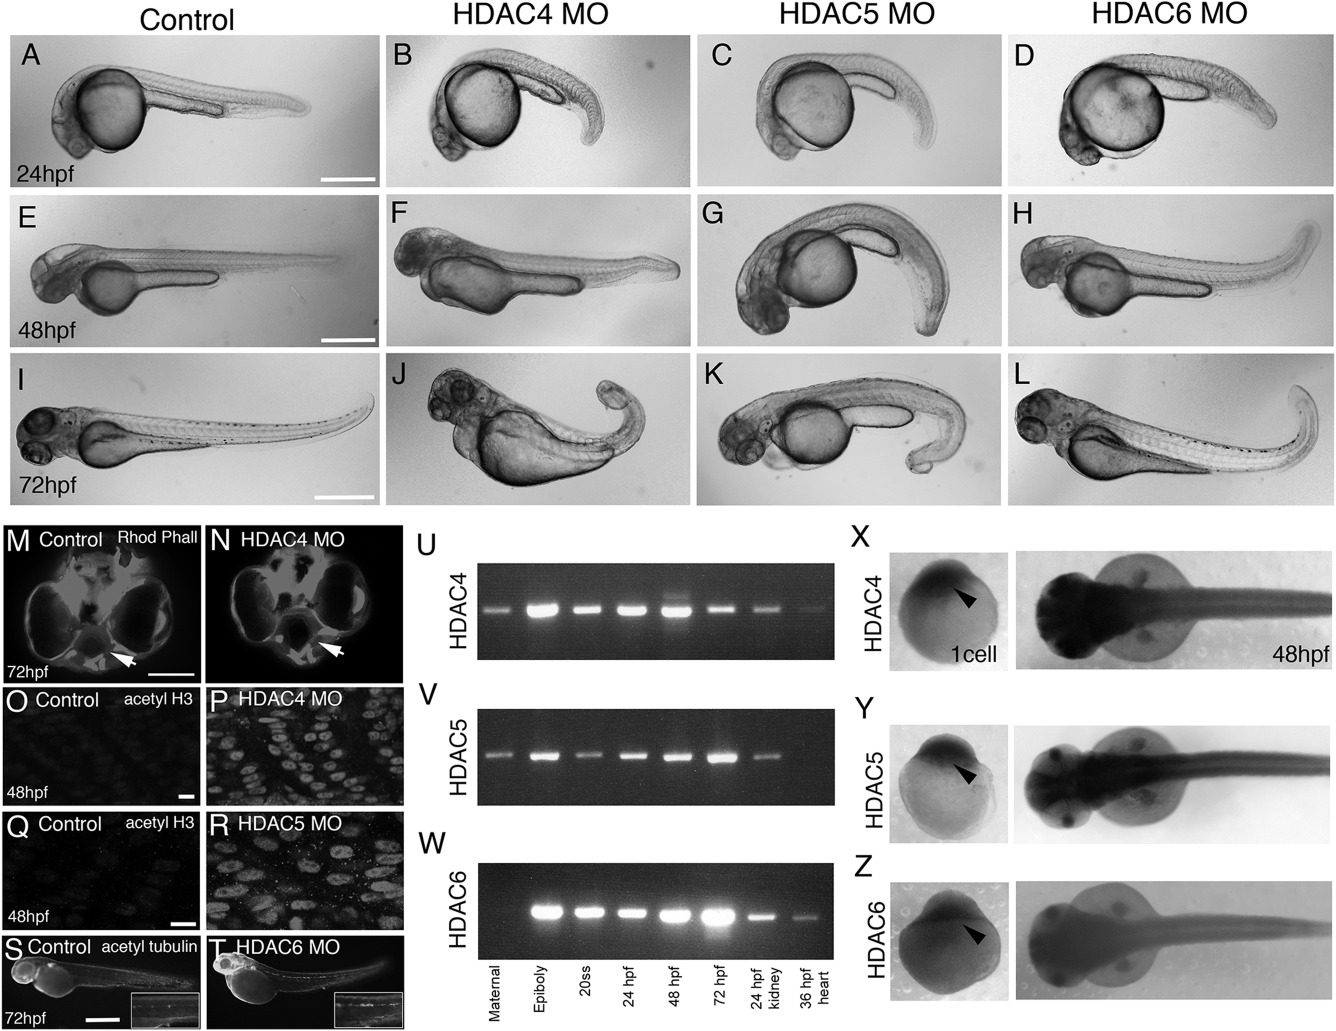
Fig. 1
Phenotype of class II HDAC morphants. Gross morphology was assessed at 24 hpf, 48 hpf, and 72 hpf in embryos injected with 2 ng control, 2 ng HDAC4, 2ng HDAC5, or 8 ng HDAC6 MO. Scale bar = 500 μm. Normal orofacial morphology in control embryos (M, arrow) is lost in HDAC4 morphants, where mouth defects and partial clefts are visible (N, arrow) at 72 hpf. Scale bar = 100 μm. Acetylated histone H3 was analyzed at 48 hpf in control embryos (O,Q), 2‐ng HDAC4 MO (P), or 2‐ng HDAC5 MO (R) embryos. Scale bar = 5 μm. Acetylated α‐tubulin was analyzed in control (S) and 8‐ng HDAC6 MO (T) embryos. Scale bar = 500 μm. Semiquantitative reverse transcription‐polymerase chain reaction assessed the expression of HDAC4, HDAC5, and HDAC6 during development (U–W). Expression of hdac4 (X), hdac5 (Y), and hdac6 (Z) was also assessed using whole‐mount in situ hybridization at the one‐cell stage (arrowhead) and at 48 hpf.

