
|
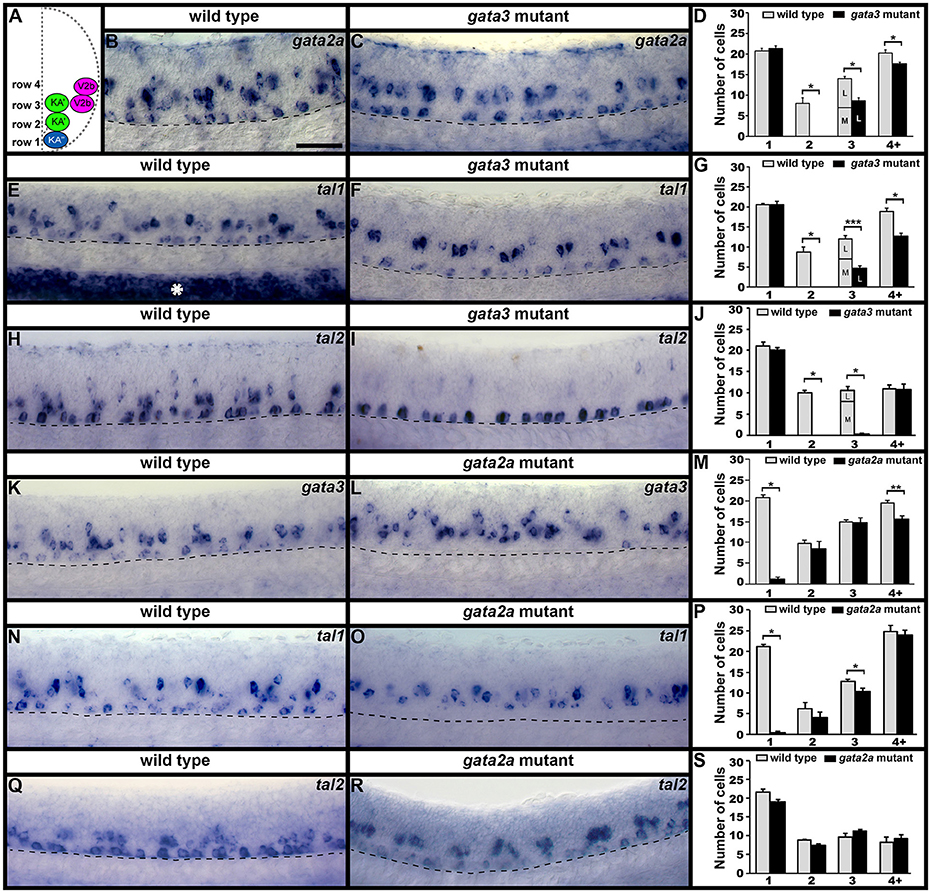
Fig. 3
gata2a, gata3, tal1, and tal2 expression in KA″, KA′, and V2b neurons is differentially regulated by gata3 and gata2a. (A) Cross-sectional schematic indicating positions of KA″, KA′, and V2b neurons. Lateral views of gata2a (B,C), tal1 (E,F,N,O), tal2 (H,I,Q,R), and gata3 (K,L) expression in 24 h WT siblings (B,E,H,J,N,Q) and gata3 (C,F,I) and gata2a (L,O,R) mutants. Dorsal, top; in lateral views, anterior, left. White asterisk in (E) indicates blood expression of tal1. Dashed lines indicate ventral limit of spinal cord. Scale bar = 50 microns. Mean number of cells expressing each gene in each D/V row of spinal cord region adjacent to somites 6–10 (D,G,J,M,P,S). For gata3 mutant results (D,G,J) the approximate proportions of medial and lateral row 3 cells are indicated by horizontal lines separating the number of medially-located cells (bottom and indicated with an “M”) from the number of laterally-located cells (top and indicated with a “L”). All of the remaining gata2a- and tal1-expressing cells in row 3 of gata3 mutants were located laterally, suggesting that they are V2b cells and that no KA′ cells express these genes in gata3 mutants. More dorsal (row 4 and above) cells expressing tal2 in gata3 mutants (I) are more weakly stained than the strongly stained KA″ cells and are in a different focal plane. All counts are an average of at least 4 embryos. Error bars indicate SEM. Statistically significant comparisons are indicated with brackets and stars. ***P < 0.001, **P < 0.01, *P < 0.05. For P-values see Supplementary Table 3.