
|
Fig. 5
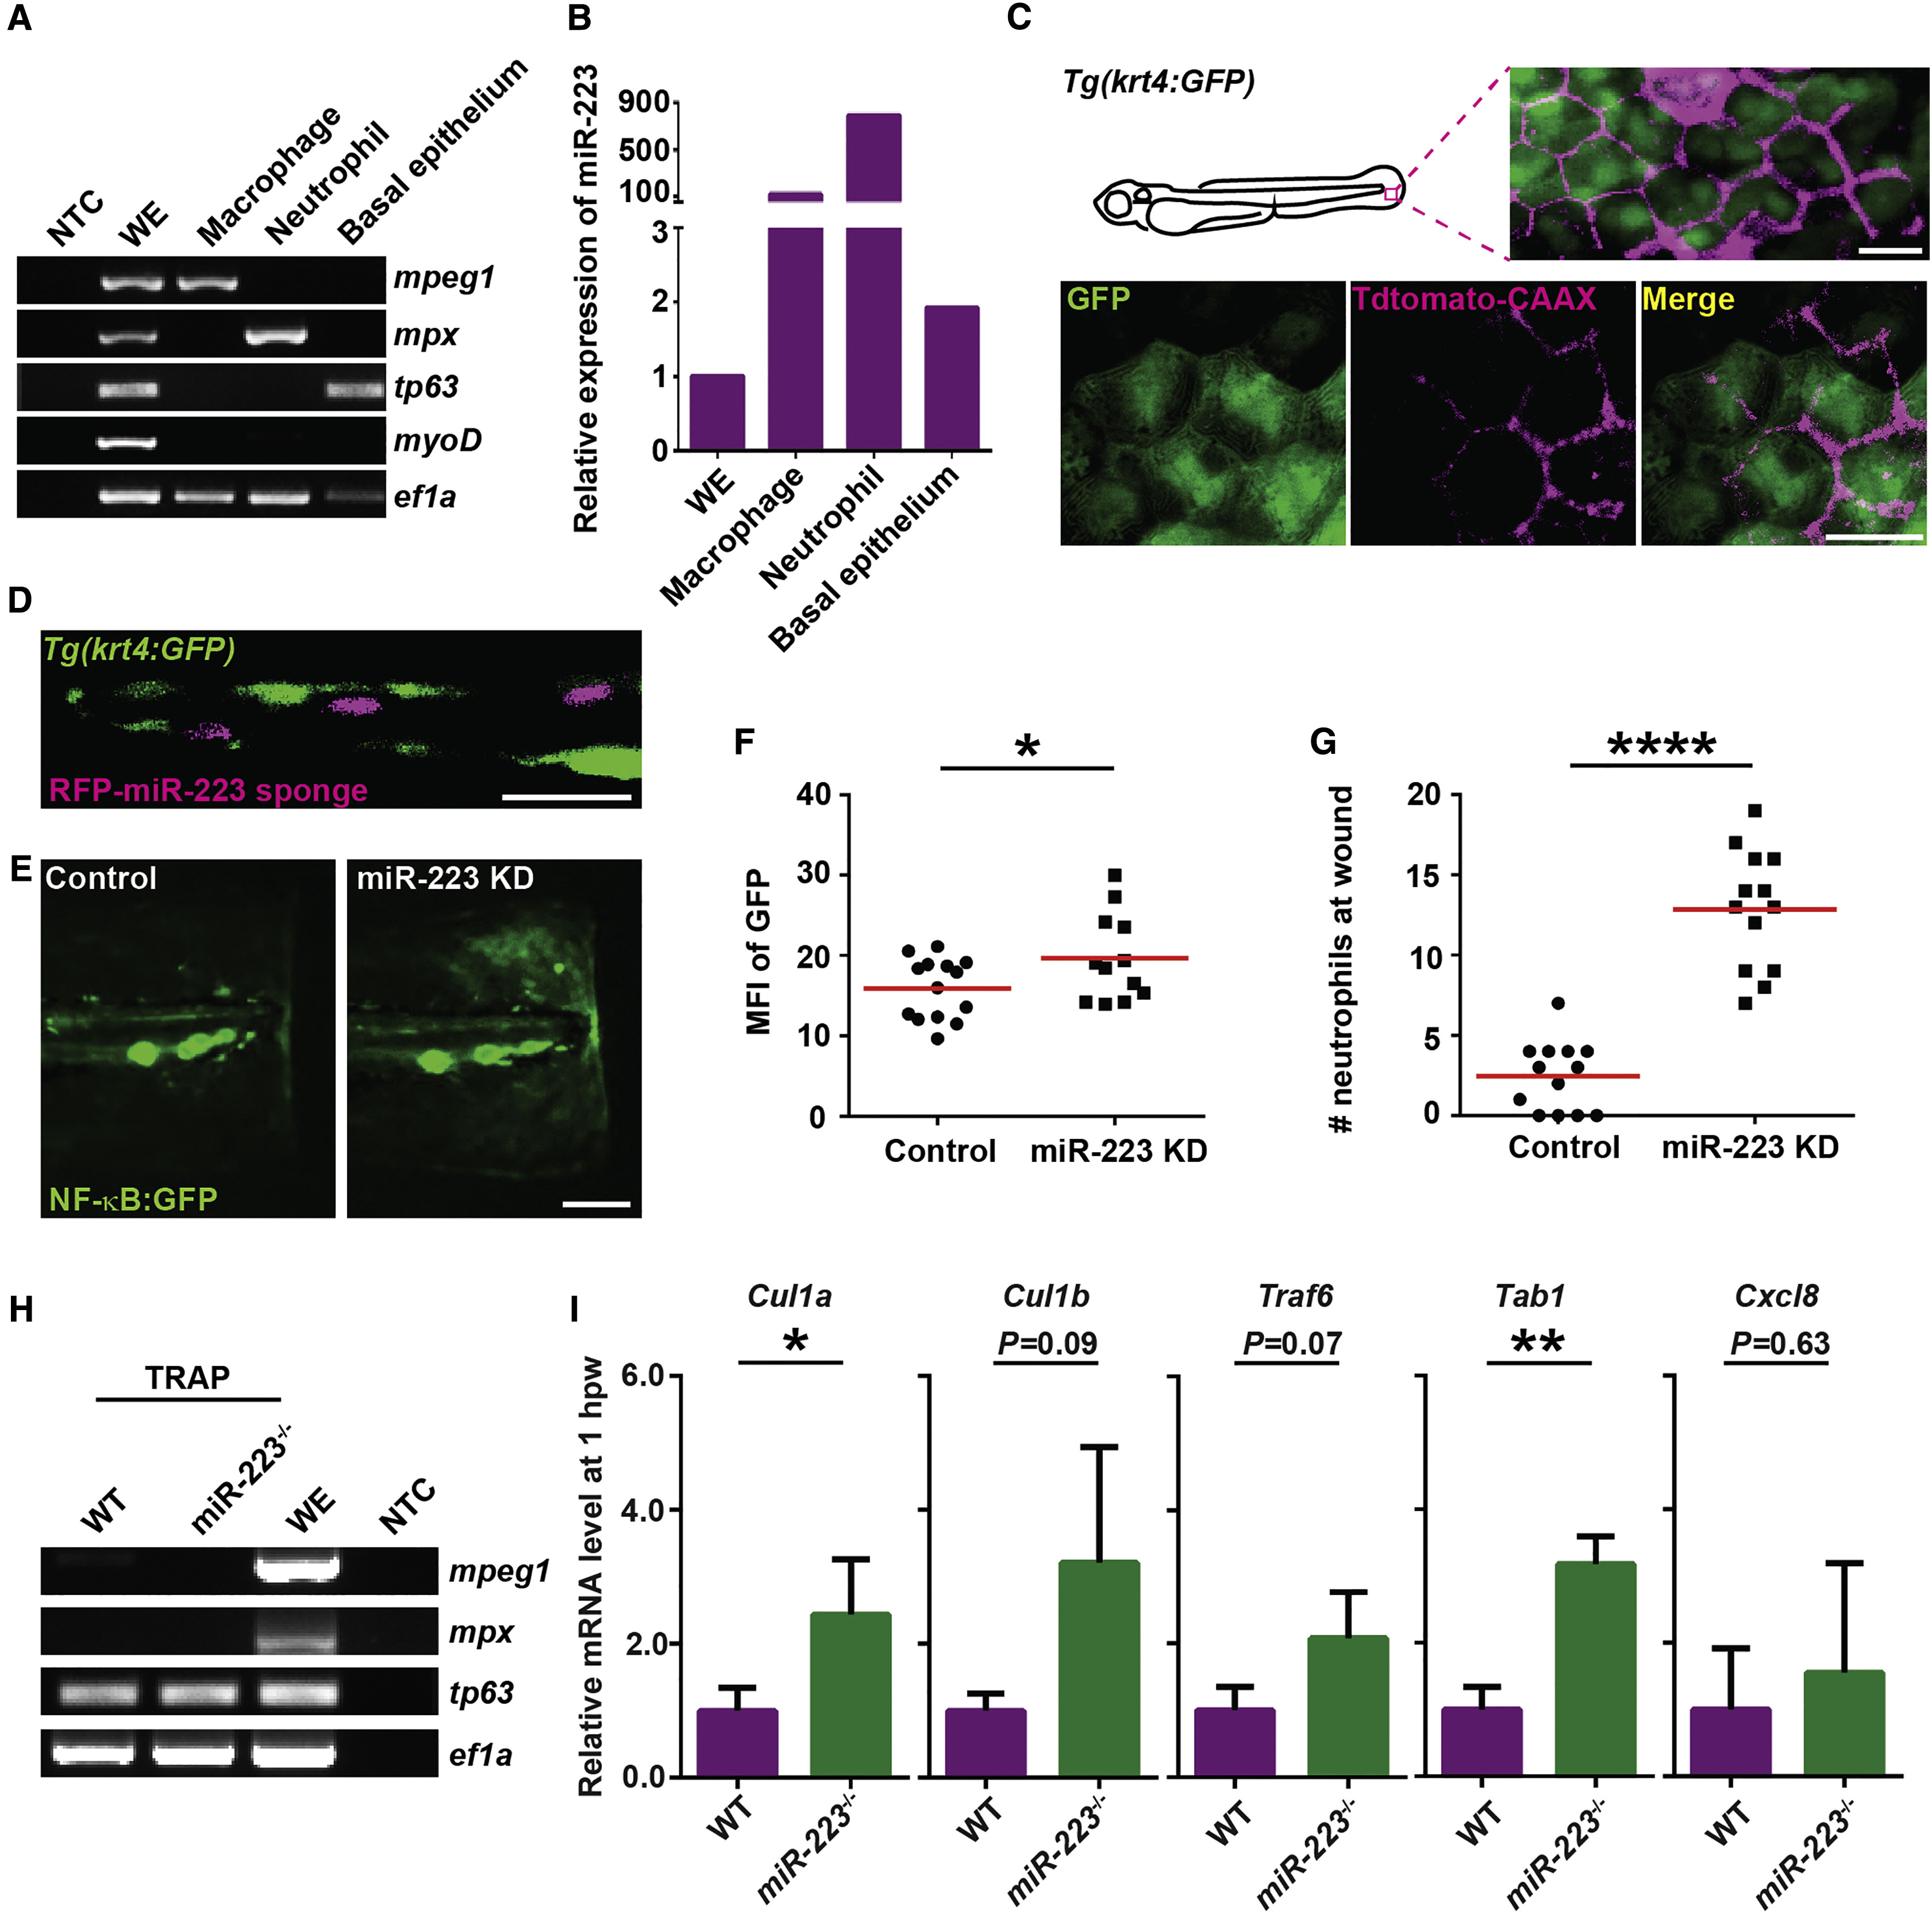
miR-223 Suppresses NF-κB Activation in Basal Epithelial Cells in a Cell-Intrinsic Manner
(A and B) Macrophages, neutrophils, and basal epithelial cells were sorted from 3 dpf embryos. (A) RT-PCR of lineage-specific markers. mpeg, macrophage marker; mpx, neutrophil marker; tp63, basal epithelial cell marker; myoD, muscle cell marker; ef1a, loading control; WE, whole embryo; NTC, non-template control. (B) qRT-PCR of miR-223.
(C) Tdtomato-CAAX mRNA was injected into Tg(krt4: GFP)pu11 embryos at 4-cell stage. Representative confocal images from the lateral view of 3 dpf larvae are shown.
(D) RFP-miR-223 sponge mRNA was injected into Tg(krt4: GFP)pu11 embryos at 4-cell stage. A representative confocal image from the vertical view of 2 dpf larvae is shown.
(E and F) Tg(NF-κB:GFP) were injected with miR-223 sponge or the RFP control mRNA at 4-cell stage. Representative images and quantification of GFP signal at the wound edge at 6 hpw are shown.
(G) Quantification of neutrophil recruitment to the wound in embryos injected with miR-223 sponge or RFP mRNA at 4-cell stage.
(H and I) Tol2-tp63-GFP-L10a was injected into WT or miR-223−/− embryos. At 3 dpf, cell-specific mRNA-ribosome complexes were isolated by anti-GFP antibodies at 1 hpw.
(H) RT-PCR of lineage-specific markers as described in (A).
(I) Real-time qPCR of indicated genes. Data are pooled from three independent experiments (mean + SD).
Scale bars, 20 um (C and D), 100 μm (E). Data are representative of three independent experiments (F and G) or of two independent experiments (A and B). ∗p < 0.05, ∗∗p < 0.01, and ∗∗∗∗p < 0.0001, unpaired Student’s t test.