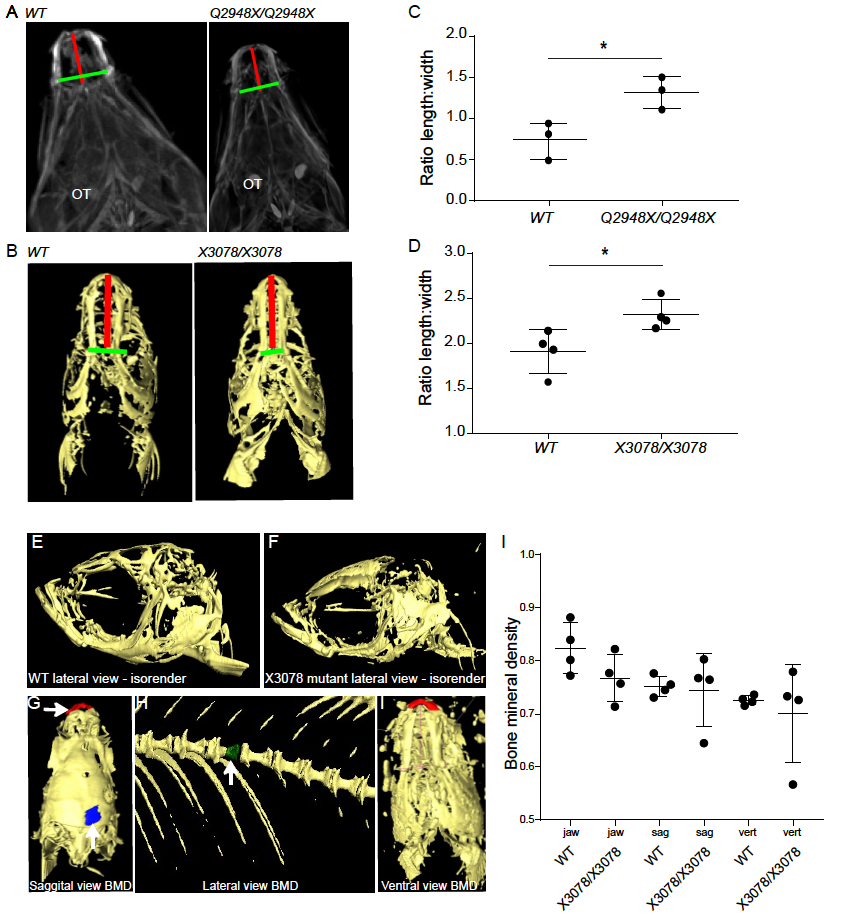
Fig. S3
Figure S3 relating to Figure 5: (A) Ventral jaw element views in 8 months old WT and golgb1Q2948X/Q2948X zebrafish, and (B) in 10-month golgb1X3078/X3078 mutant and WT zebrafish derived from micro CT images. The relative distance from the anterior most point of the lower jaw to the mid-point between the jaw joints and the width between joints is demarked by the red and green line respectively and the ratio between these is calculated in C and D. (E, F) Ventral isorenders of the (E) WT and (F) golgb1X3078/X3078 mutants. (G-I) Red and blue patches highlight regions on isosurface renders of CT images used for calculation of BMD from a (G) saggital view of the skull, (H) lateral view of the vertebral column and (I) ventral view of the jaw. (J) Quantification of BMD shows no significant differences between WT and mutants in jaw, saggital, or vertebral measurements. Data were analysed using an unpaired t-test; p value: *= <0.05, mean and standard deviation). Data was taken from between 15 and 30 sections per fish (details in methods).

