Fig. 2
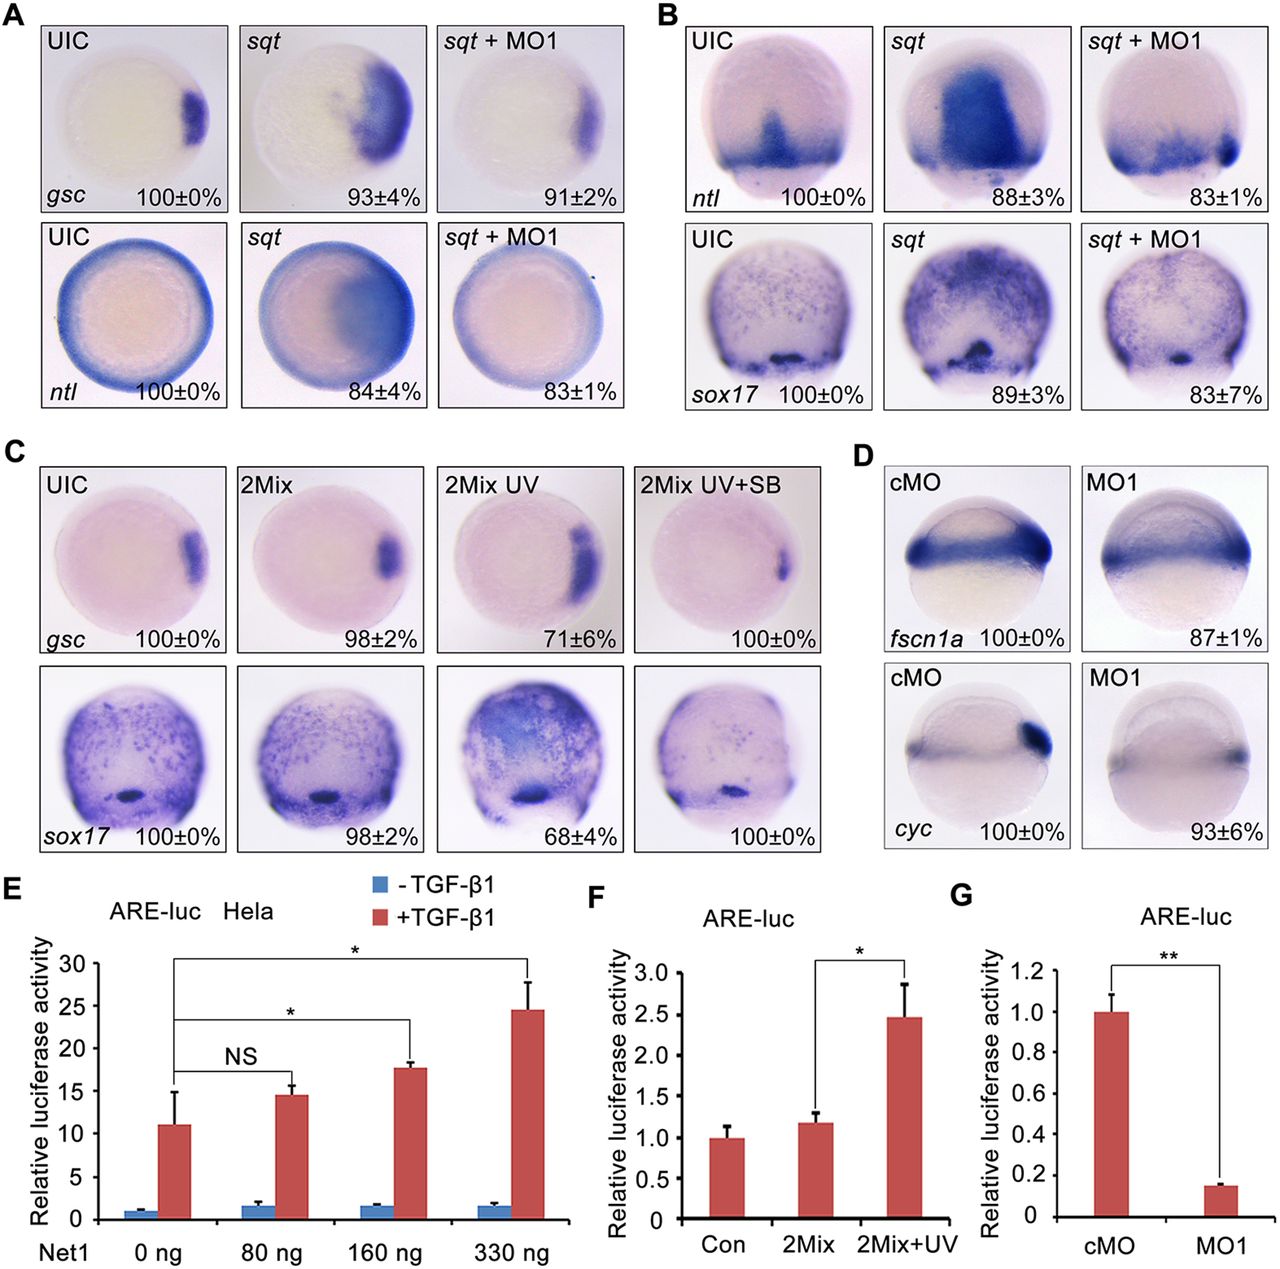
Net1 upregulates Nodal signal transduction. (A,B) Knockdown of net1 decreases Nodal ligand-induced mesendoderm expansion. Wild-type embryos were injected with 1 pg sqt mRNA alone or concurrently with 4 ng net1 MO1 at the one-cell stage, harvested at the shield and 75% epiboly stages, and analyzed for the expression of indicated marker genes by using whole-mount in situ hybridization. (C) Zebrafish embryos were injected with net1 2Mix (300 pg Flag-net1 mRNA and 1 ng AS-Flag-photo-MO) at the one-cell stage. A subset of these embryos was treated with 25 μM SB431542 (SB) from the 64-cell stage, of which a portion was exposed to UV light at the sphere stage. The expression of gsc and sox17 was examined by in situ hybridization at the shield and 75% epiboly stages, respectively. (D) The expression of Nodal target genes cyc and fscn1a in cMO- and net1 MO1-injected embryos at shield stage. Lateral view with animal pole to the top. In A–D, the percentages (mean±s.d.) of the affected embryos are shown as calculated from three independent biological repeats with ∼15–25 embryos in each group. UIC, uninjected control. (E,F) Overexpression of Net1 enhanced ARE-luciferase expression. (E) HeLa cells were transfected with the ARE-luciferase reporter concurrently with increasing amounts of Net1. At 36 h post transfection, the cells were treated with TGF-β1 or left untreated overnight, and then harvested for luciferase assays. *P<0.05; NS, not significant (Student's t-test). (F) At the one-cell stage, zebrafish embryos were injected with the ARE-luciferase reporter alone or together with net1 2Mix. At the sphere stage, half of the net1 2Mix-injected embryos were exposed to UV light, and then all embryos were harvested at the shield stage for luciferase assays. *P<0.05 (Student's t-test). (G) Knockdown of net1 inhibits ARE-luciferase expression. At the one-cell stage, zebrafish embryos were co-injected with the ARE-luciferase reporter and cMO or net1 MO1, and then harvested at the shield stage for luciferase assays. **P<0.01 (Student's t-test). Results in E–G are mean±s.d. (n=3).

