Fig. 1
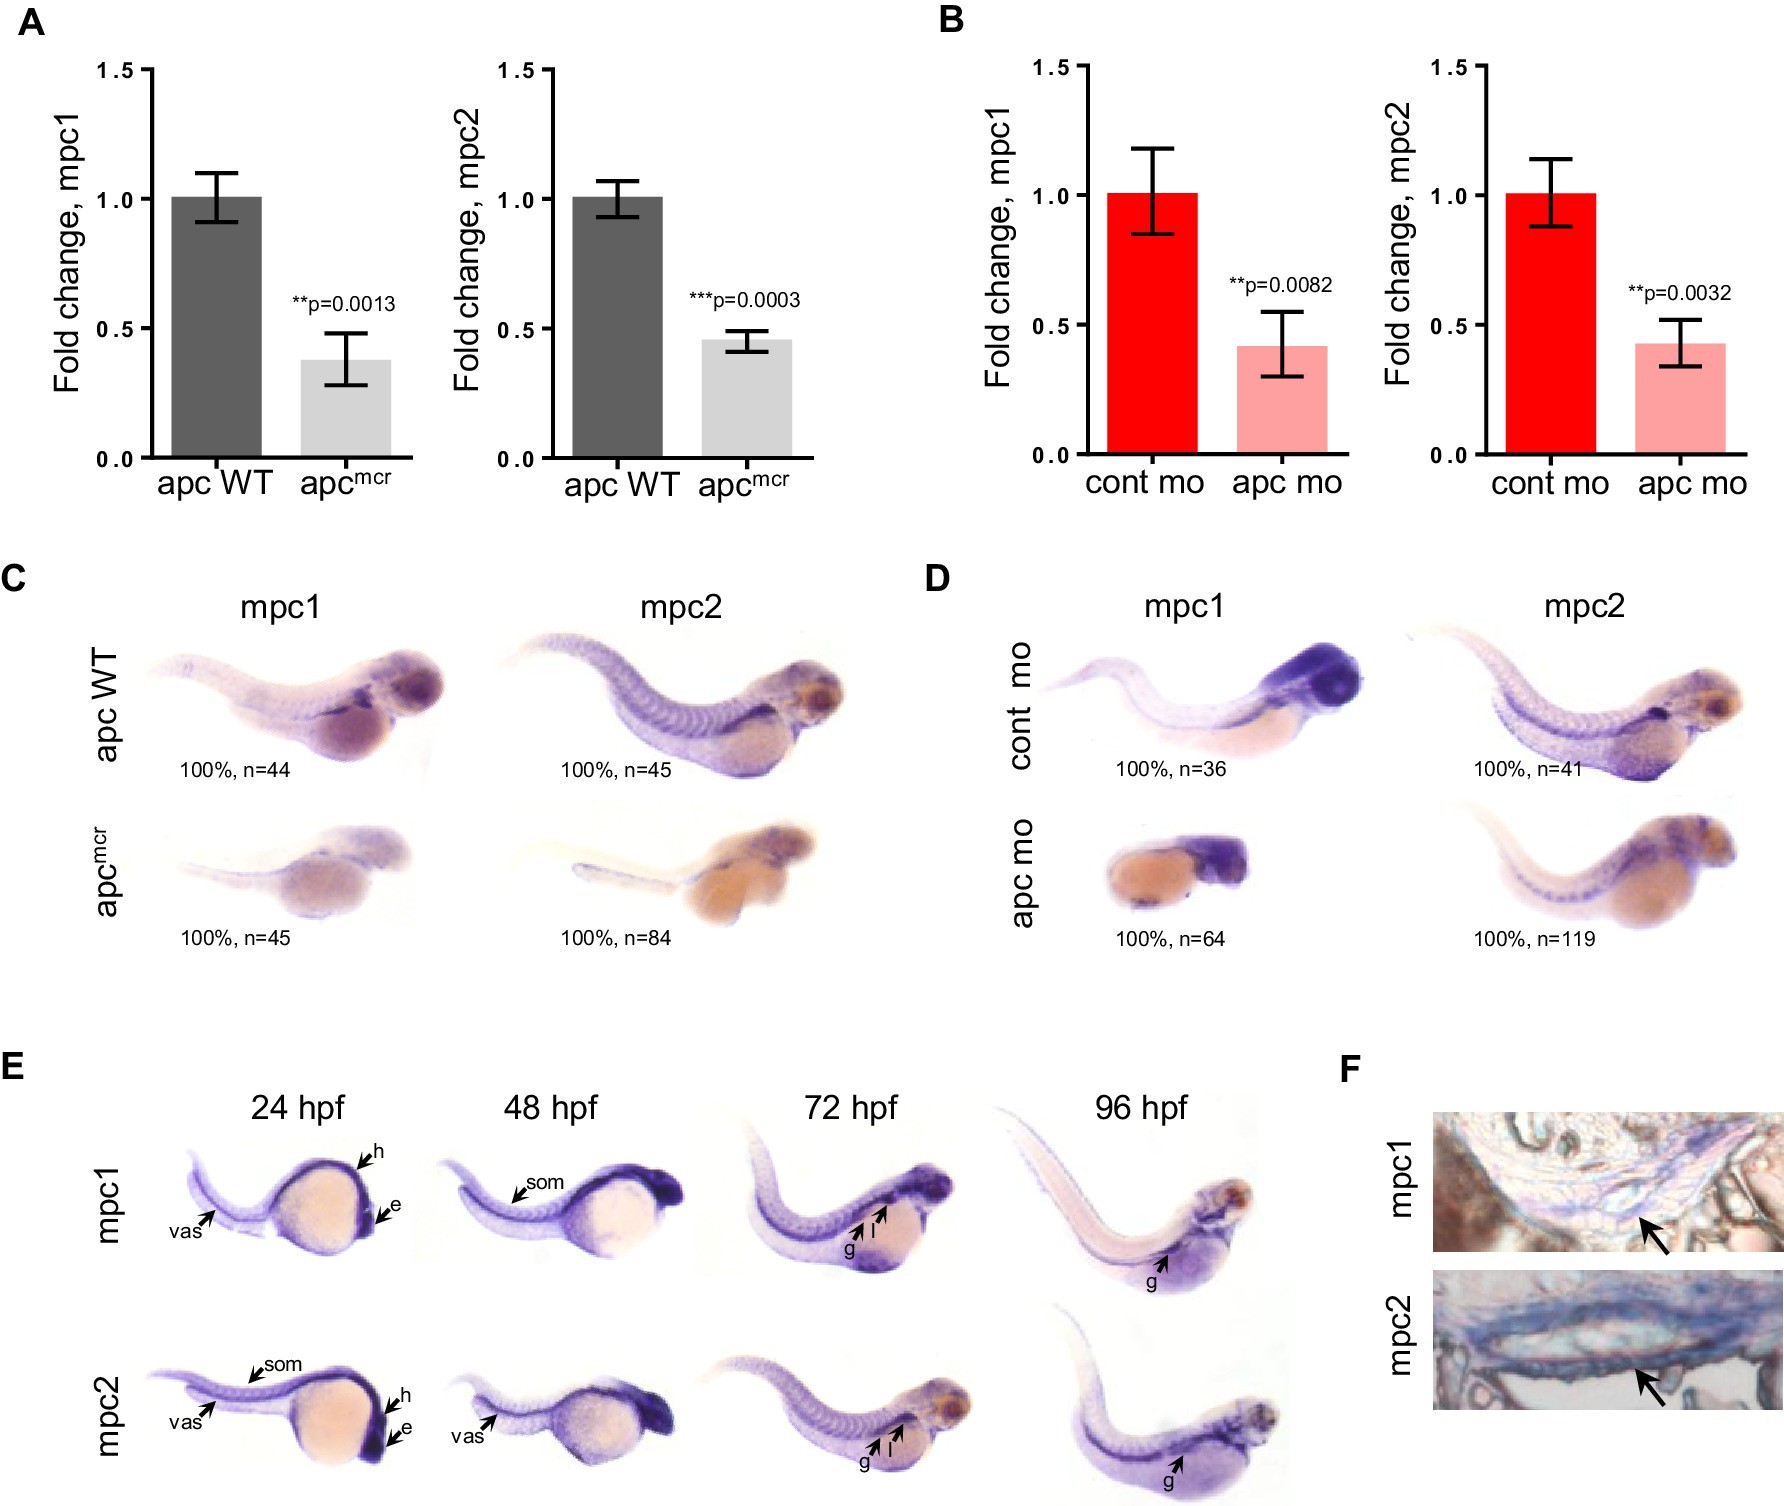
mpc1 and mpc2 are downregulated in apcmcr and apc morphant embryos.
(A,B) Quantitative RT-PCR analysis of mpc1 and mpc2 gene expression in apcmcr (A) and apc mo (B) embryos. Values represent mean ± SD. Graph shown above is representative of at least three independent experiments. Statistical significance was analyzed using unpaired t-test. (C,D) Whole mount in situ hybridization for mpc1 and mpc2 in 72 hpf apcmcr (C) and apc mo (D) embryos. (E) Whole mount in situ hybridization for mpc1 and mpc2 in wild type (WT) embryos. head (h), eyes (e), somite (som), vasculature (vas), gut (g), liver (l). (F) Cross sections from 96 hpf WT embryos probed with either mpc1 or mpc2 confirmed gut-specific expression of both genes. See also Figure 1—figure supplement 1.

