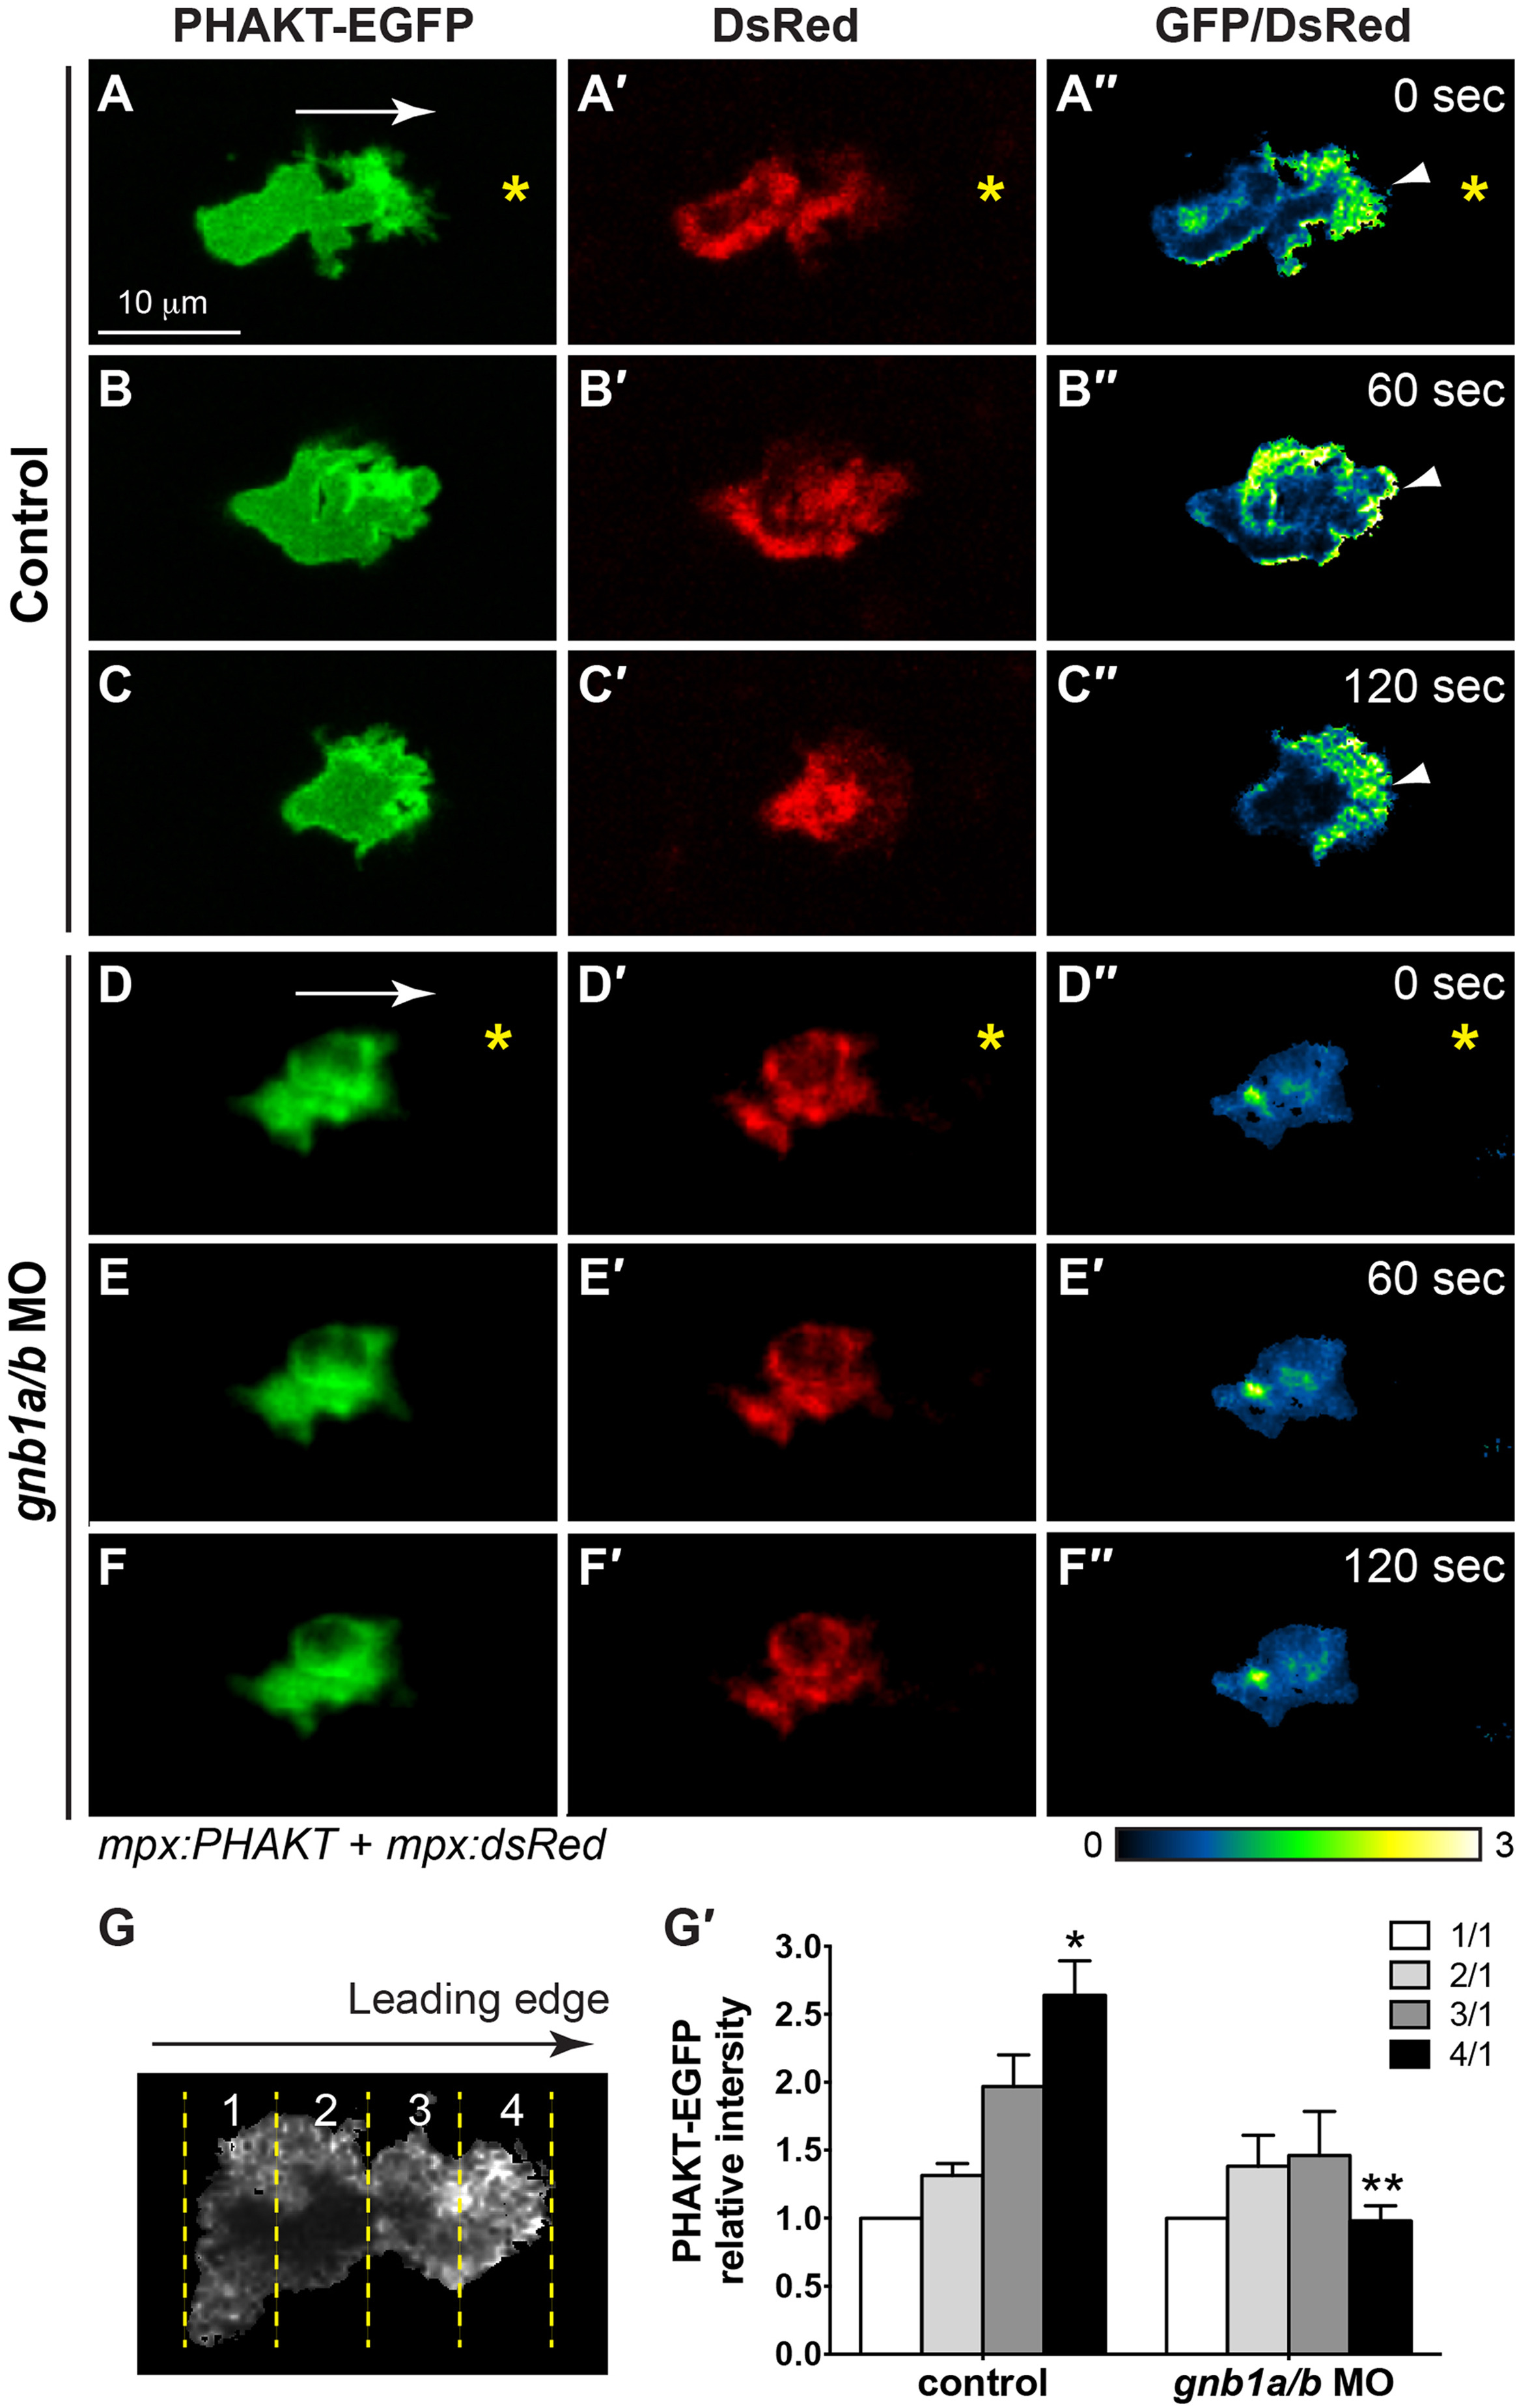
Fig. 6
Gβ1 signaling regulates directed neutrophil migration by activating PI3K. (A-F′′) Snapshots from confocal time-lapse imaging (Supplementary Movie 6) of migrating neutrophils expressing PHAKT-EGFP and DsRed in control (A-C) and gnb1a/b MO1-injected (D-F) embryos following wounding of tailfin. (A-F) PHAKT-EGFP. (A′-F′) DsRed. (A′′-F′′) Ratiometric images of PHAKT-EGFP/DsRed. Yellow asterisks: side nearest wound; white arrowheads: PHAKT-GFP enrichment at neutrophil leading front; white arrows: direction of migration. (G-G′) Quantification of ratios of intensity of PHAKT-EGFP/DsRed. (G) Illustration of the method. Neutrophils were selected for “plot profile” analysis using the rectangle tool to span the leading and trailing edges of the cells. The measurements were grouped by quarter and the average GFP/DsRed intensity in each quarter was calculated, with the first quarter representing the trailing region and the fourth quarter representing the leading region. (G′) Graph showing the ratio of intensities of PHAKT-GFP/DsRed in each quarter relative to that in the first quarter in control (5 neutrophils in 5 embryos) and gnb1a/b MO1-injected (7 neutrophils in 7 embryos) embryos. * p = 0.003 vs 1/1 in control, ** p = 0.0001 vs 4/1 in control by t-test, two-way ANOVA; p < 0.0001 among groups in control embryos, by one-way ANOVA; p = 0.587 among groups in gnb1a/b MO1-injected embryos, by one-way ANOVA.
Reprinted from Developmental Biology, 428(1), Ke, W., Ye, D., Mersch, K., Xu, H., Chen, S., Lin, F., Gβ1 is required for neutrophil migration in zebrafish, 135-147, Copyright (2017) with permission from Elsevier. Full text @ Dev. Biol.

