
|
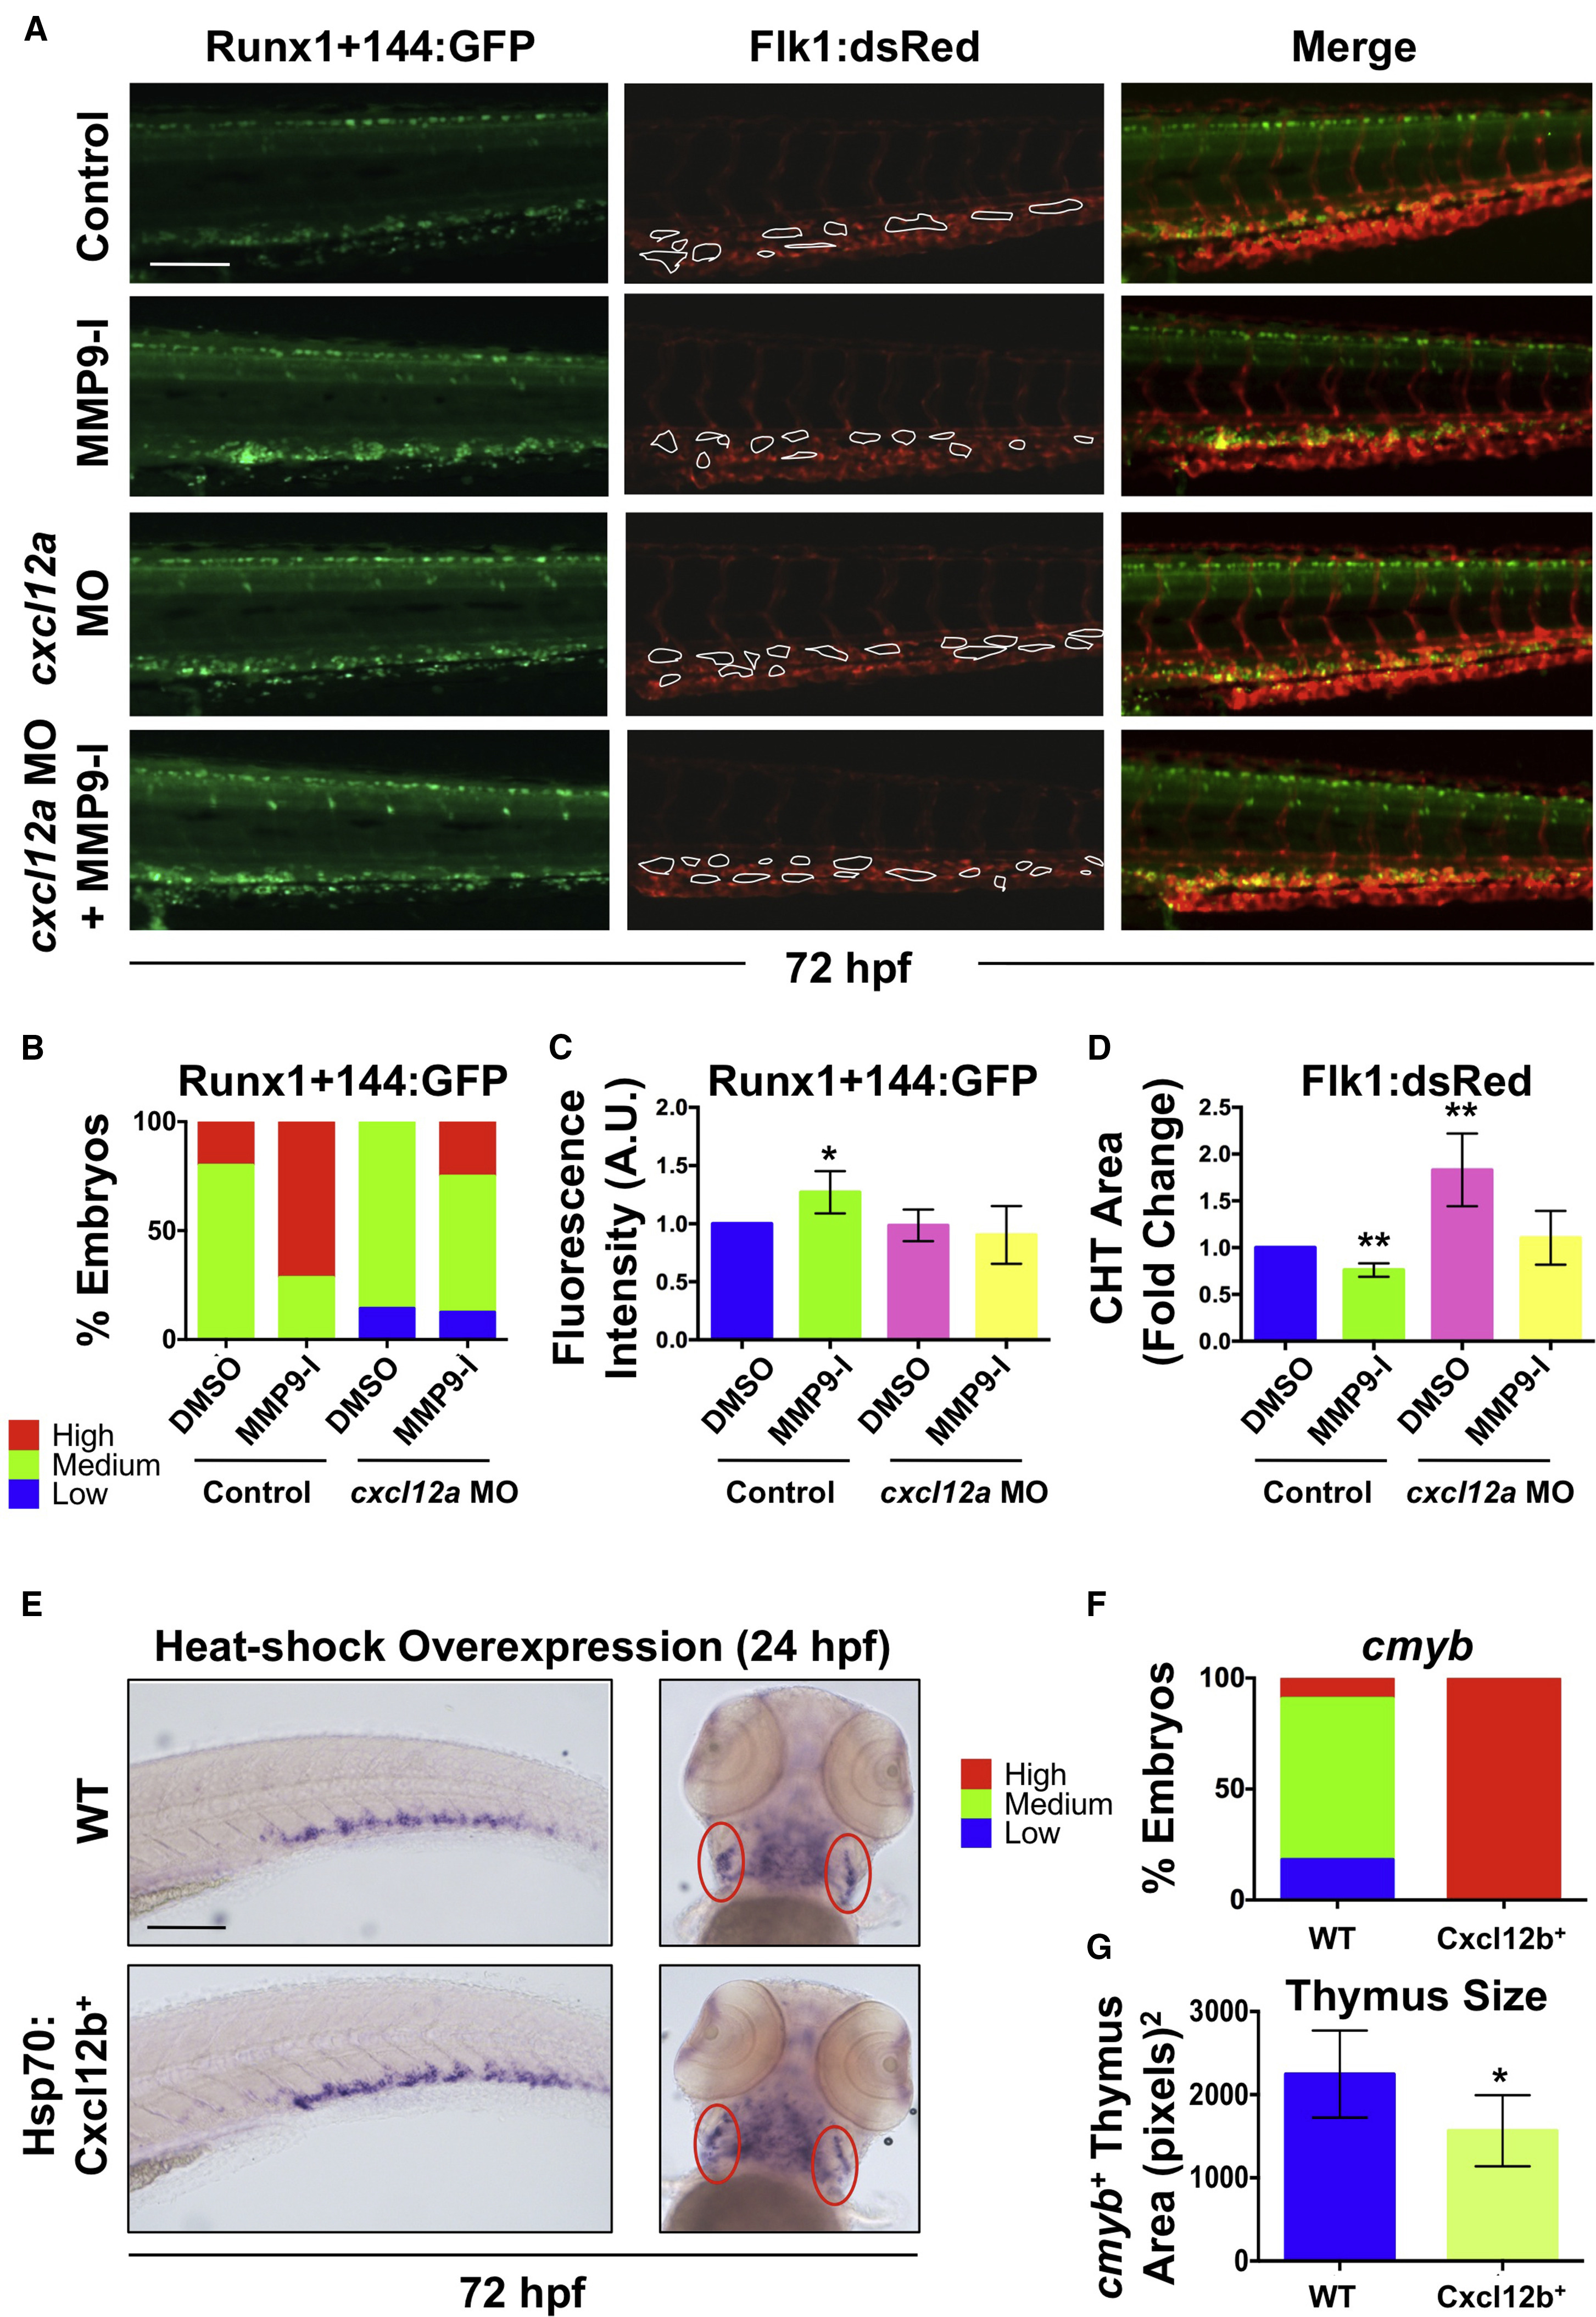
Fig. 7
Mmp9 Affects HSPC CHT Homeostasis via Regulation of Cxcl12 Signaling
(A) Knockdown of cxcl12a in Runx1+144:GFP+/Flk1:dsRed+ embryos blocked the effect of MMP9-I exposure (12–72 hpf) on Runx1+144:GFP localization (left); MMP9-I-associated hypovascularity was also antagonized (n ≥ 10/condition; center). Merged images are on the right.
(B) Qualitative phenotypic distribution of embryos from (A) scored with low, medium, or high Runx1+144:GFP expression in the CHT at 72 hpf (n ≥ 10/condition).
(C) ImageJ analysis revealed a significant increase in Runx1+144:GFP fluorescence intensity in the CHT with MMP9-I exposure alone (mean ± SEM; two-tailed t test; ∗p < 0.05; n ≥ 10/condition), but not in cxcl12a morphants.
(D) ImageJ analysis of Flk1:dsRed at 72 hpf indicated that a significant decrease in vascularized CHT plexus area from MMP9-I exposure (mean of quadruplicate experiments ±SEM; two-tailed t test; ∗∗p < 0.01; n ≥ 10/condition) was alleviated in cxcl12a morphants.
(E) Heat-shock (37°C, 30 min at 24 hpf) overexpression of Cxcl12b enhanced cmyb expression in the CHT (left) but decreased thymic staining (right) at 72 hpf. Ovals (red) highlight paired thymii.
(F) Qualitative phenotypic distribution of embryos from (E) scored for cmyb expression in the CHT at 72 hpf (n value and scoring as in B).
(G) ImageJ analysis showed decreased cmyb+ thymic area at 72 hpf after Cxcl12b overexpression (37°C, 30 min at 24 hpf; ∗p < 0.05).
WT, wild-type. Error bars denote mean ± SD. Scale bars, 100 μm.