Fig. 1
Fig. 1
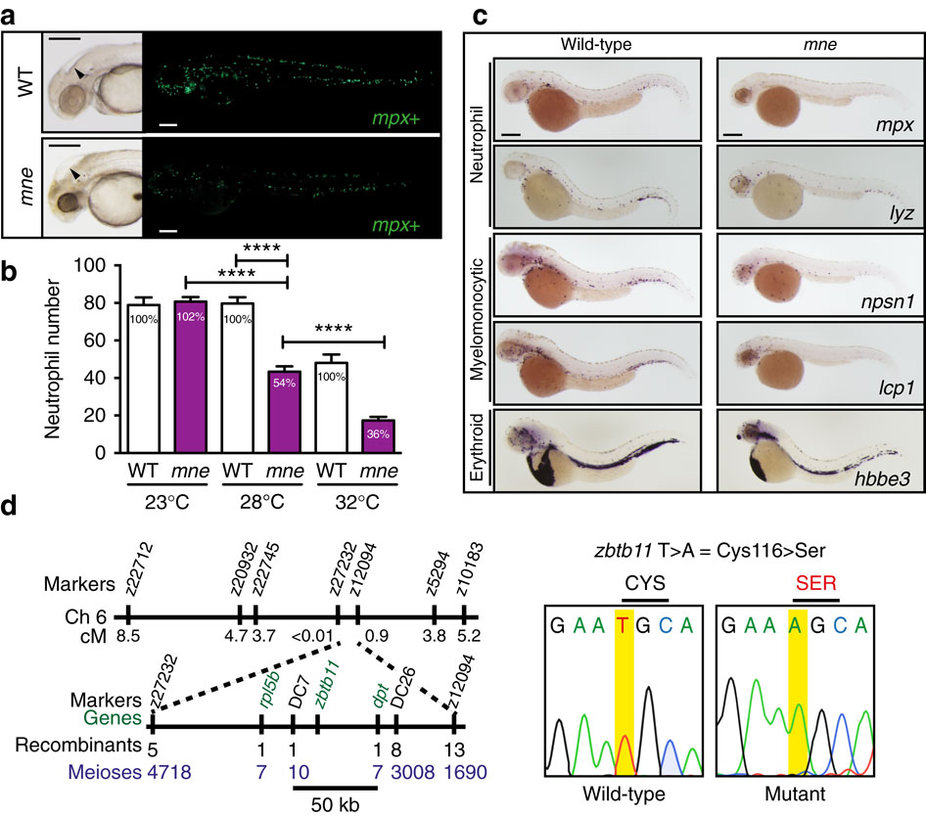
mne presents a myeloid phenotype at 48 h.p.f. and maps to zbtb11.
(a) Brightfield: enlarged fourth ventricle (arrow-head), small dark eye and opacity due to CNS degeneration. Fluorescence: fewer mpx:EGFP-positive cells in mne compared to WT (enumerated in b). (b) Neutrophil deficiency, reflected by the abundance of mpx:EGFP-positive cells, is exacerbated by increasing temperature in the temperature-sensitive mutant mne. Percentage of neutrophils compared to WT is stated in the columns (data from one experiment (from left to right: n=11, 12, 19, 12, 10, 11) representative of four biologically independent replicates, two-tailed t-test; ****P≤0.0001). (c) Decreased expression of multiple myeloid genes in mne. Whole-mount in situ hybridization of mne and WT siblings with neutrophil (mpx, lyz), myelomonocytic (lcp1, npsn1), and erythroid (hbbe3) markers at 48 h.p.f. (d) Summary of marsanne genome scan data defining a region narrowed by positional cloning to a 50 kb critical interval, which contained a single gene, zbtb11. Sequencing of mne zbtb11 identifies a single T>A transversion in exon 2 resulting in a Cys>Ser substitution at amino acid 116 (C116S); scale bars, 200 μm (a,c).

