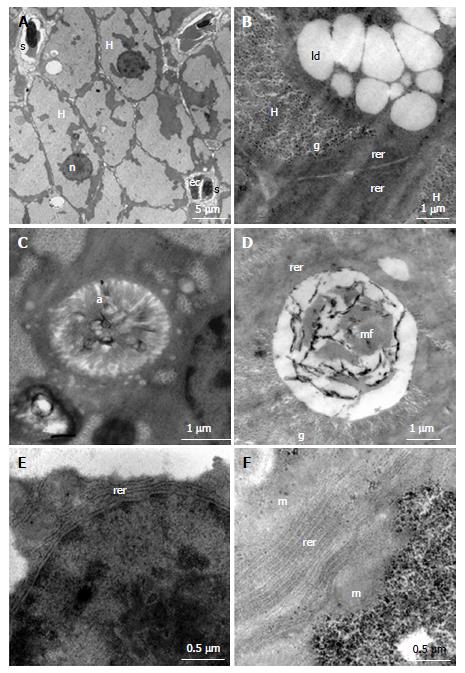
Fig. 3
Electron micrographs of liver sections of control (A, C and E) and ethanol exposed groups (B, D and F). A: Polygonal hepatocytes (H), spherical nucleus (n) sinusoid (s), endothelial cell (ec); B: Presence of large amount of glycogen (g) and lipid droplets (ld) in the hepatocytes cytoplasm; C: Intracellular canaliculus with large number of microvilli (a) within; E: It is noted the parallel arrangement of rough endoplasmic reticulum (rer) around the core; D: Myelin figure (mf) inside an intracellular canaliculus; F: Rough endoplasmic reticulum (rer) composed by 8-12 parallel cisterns; H: Hepatocytes; ec: Endothelial cell.

