Fig. 6
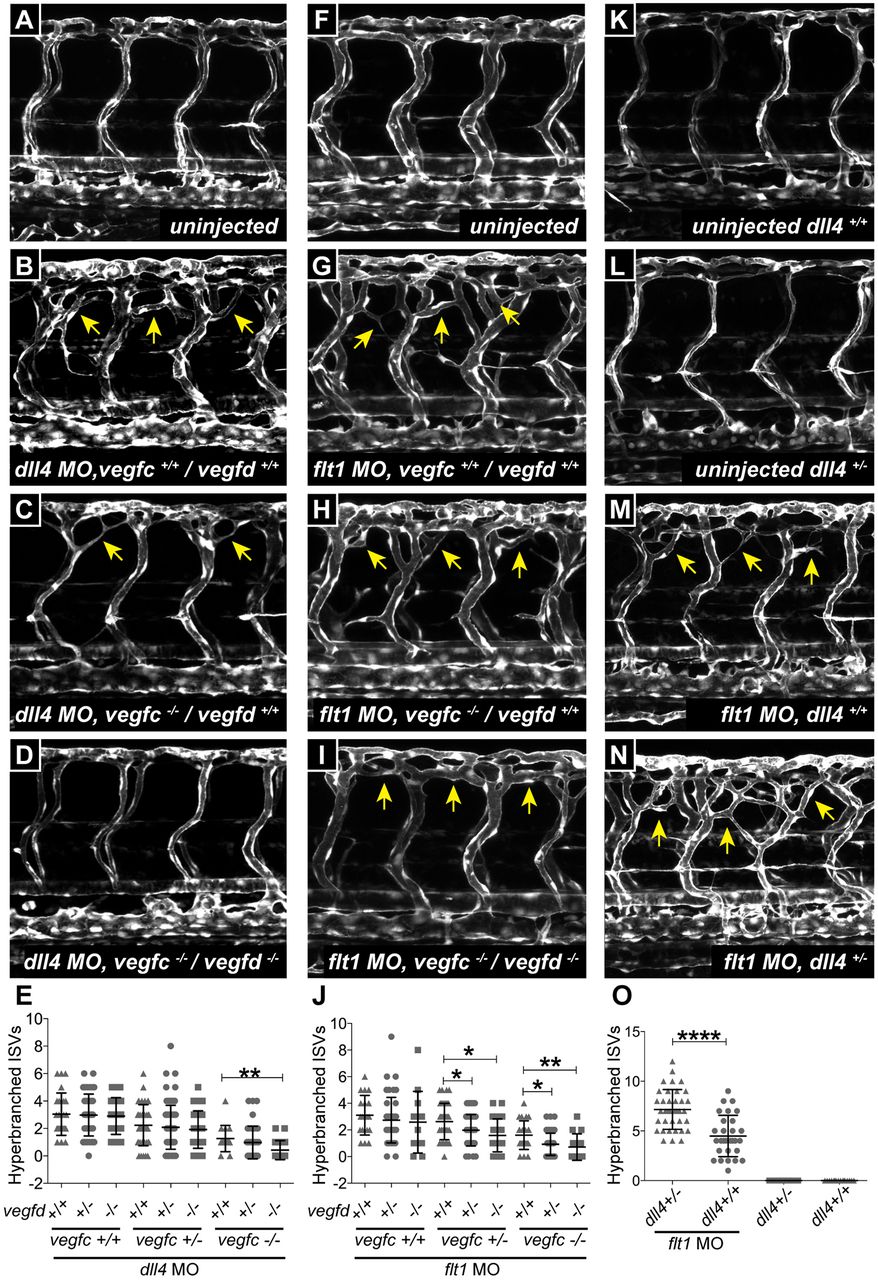
Dll4 and Flt1 suppress Vegfc and Vegfd signaling in developing intersegmental arteries. (A-D) Confocal images of aISVs in 3 dpf Tg(fli1a:egfp) uninjected wild-type control (A), dll4 morpholino (MO)-injected control (B), dll4 MO-injected vegfchu5055 mutant (C) and dll4 MO-injected vegfchu5055, vegfduq9bh double mutant (D) embryos. Arrows indicate hyperbranching. (E) Quantification of hyperbranching in the experiment shown in A-D. dll4 MO-injected vegfchu5055, vegfduq9bh double-mutant embryos (n=20) had significantly fewer hyperbranched aISVs than dll4 MO-injected vegfchu5055 mutants (n=15). (F-I) Confocal images of aISVs in 3 dpf Tg(fli1a:egfp) uninjected wild-type control (F), flt1 MO-injected control (G), flt1 MO-injected vegfchu5055 mutant (H) and flt1 MO-injected vegfchu5055, vegfduq9bh double-mutant embryos (I). Arrows indicate hyperbranching. (J) Quantification of hyperbranching in the experiment shown in F-I. flt1 MO-injected vegfchu5055, vegfduq9bh double-mutant embryos (n=34) had significantly fewer hyperbranched aISVs than vegfduq9bh heterozygous (n=75) and wild-type (n=43) embryos in a vegfchu5055 heterozygous background. vegfduq9bh mutant embryos (n=14) also had significantly fewer hyperbranched aISVs than vegfduq9bh heterozygous (n=52) and wild-type (n=23) embryos in a vegfchu5055 mutant background. (K-N) Confocal images of aISVs in uninjected Tg(fli1a:egfp) wild-type embryos (n=21) (K), uninjected dll4uq10bh heterozygous embryos (n=22) (L), flt1 MO-injected wild-type embryos (n=37) (M) and flt1 MO-injected dll4uq10bh heterozygous embryos (n=29) (N) at 3 dpf. Arrows indicate hyperbranching. (O) Quantification of hyperbranching in the experiment shown in K-N. There was no hyperbranching of aISVs in dll4uq10b heterozygous embryos compared with their wild-type siblings at 3 dpf (the phenotype initiates later in heterozygotes – see Fig. S3C). Hyperbranching was induced by 3 dpf following injection of flt1 MO in wild-type embryos and the effect was significantly enhanced in dll4uq10b heterozygous embryos. For all of the above analysis, data are mean±s.e.m.; ****P<0.0001, **P<0.01, *P<0.05 from one-way ANOVA. Data were obtained from three independent MO injections.

