Fig. 5
Fig. 5
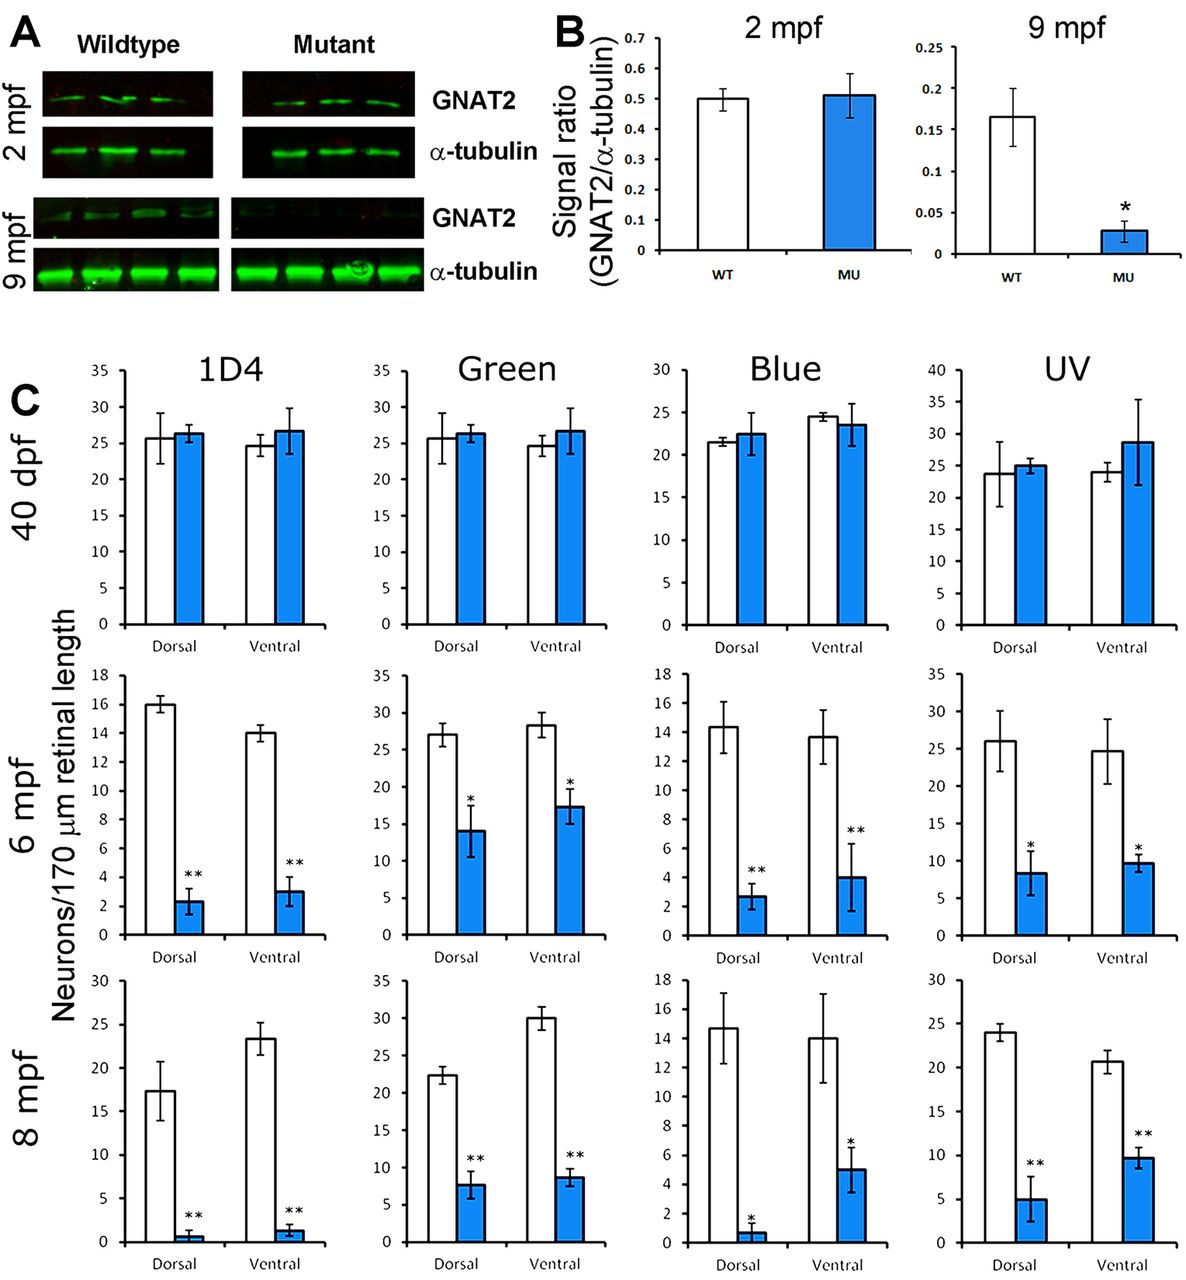
Reduction of GNAT2 protein and cone density in EYS-deficient zebrafish. Western blotting for GNAT2 was performed on retinal lysates from 2 mpf and 9 mpf zebrafish. Cone density was determined by counting 1D4-, green opsin-, blue opsin-, and UV opsin-positive cells in the dorsal and ventral retina. (A) Western blot for GNAT2 and α-tubulin. Note that while GNAT2 signal was not changed in 2 mpf mutant zebrafish, it was diminished in 9 mpf mutant zebrafish. (B) Quantification of western blot shown in A. *P<0.05, Student's t-test, two-tailed. Error bars indicate SEM (standard error of the mean). (C) Cone density in EYS-deficient zebrafish was normal at 40 dpf but reduced at 6 and 8 mpf. *P<0.05; **P<0.01 (repeated measures ANOVA). Error bars indicate s.e.m.

