
Image
|
Figure Caption
Fig. 9
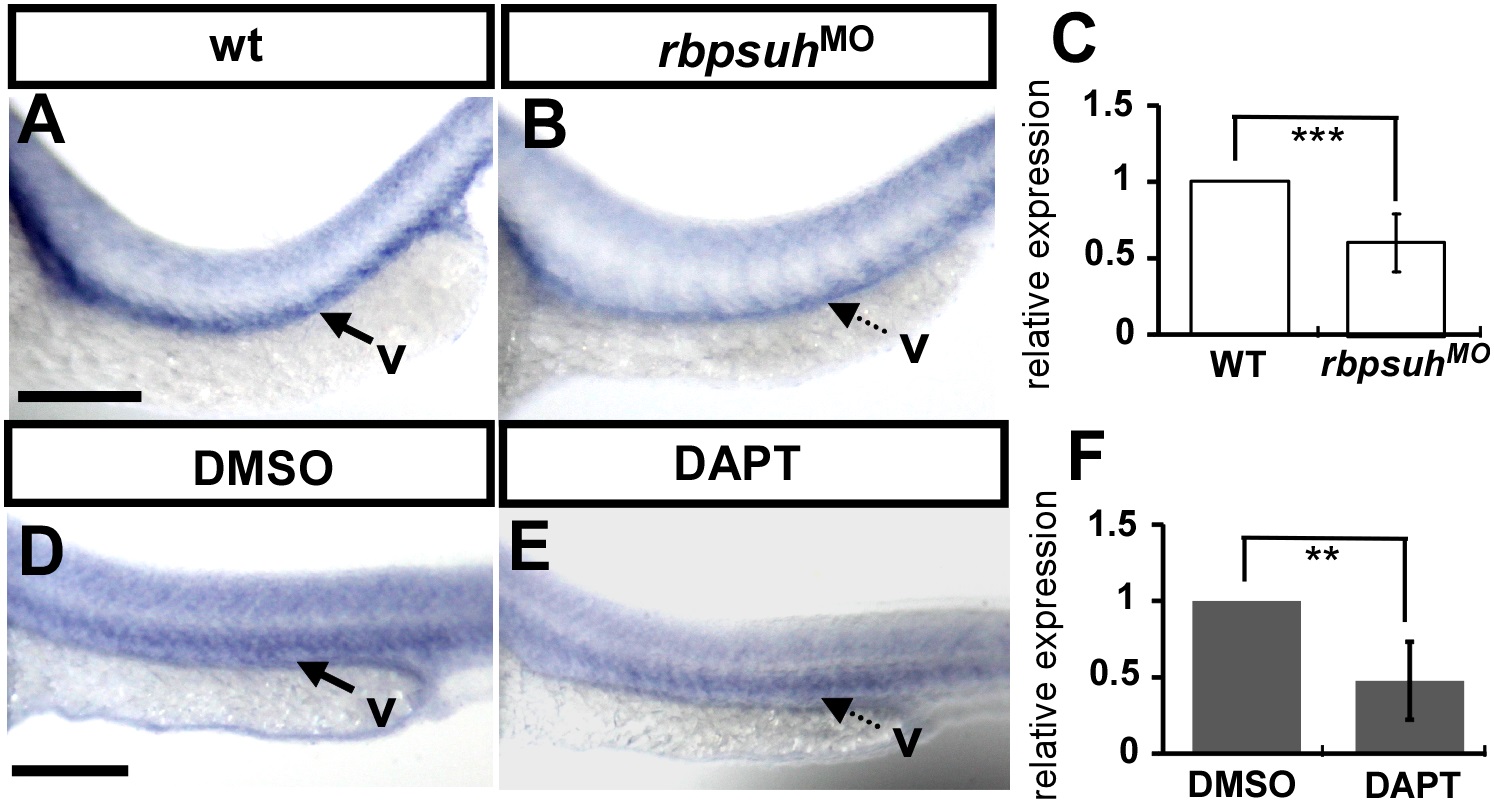
Regulatory relationships between nr2f1a and Notch.
(A-B) nr2f1a expression is downregulated in rbpsuh morphants (B) as compared to untreated control embryos (A). (D-E) nr2f1a expression is downregulated after treatment with DAPT (E) as compared to DMSO control embryos (D). (C, F) Quantification of the relative nr2f1a expression level by real-time qPCR assay shows a ~50% reduced expression in rbpsuh morphants (C) and DAPT-treated embryos (F) compared to uninjected embryos and DMSO-treated controls. Scale bars represent 100 µm in A, B, D and E.
Figure Data
Acknowledgments
This image is the copyrighted work of the attributed author or publisher, and
ZFIN has permission only to display this image to its users.
Additional permissions should be obtained from the applicable author or publisher of the image.
Full text @ PLoS One