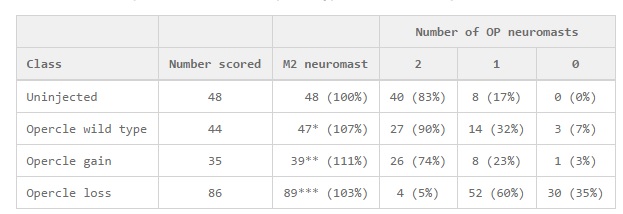
Fig. Table 2
Correlations between opercle and neuromast phenotypes in edn1-MO-injected larvae.
We scored presence or absence of neuromasts in the pharyngeal region (see their labeling in Fig. 7), and (on the same sides of the same larvae) the bone phenotypes. For the table, classes were assigned by phenotype of the opercle, irrespective of amount of injected edn 1-MO. The frequency distributions for the bone and cartilage phenotypes from the same set of larvae are shown in Fig. 6. As the phenotype varies between the two sides of a single larva, each side of each larva was scored separately, and ′Number scored′ refer to sides scored. We used Chi-square analysis (data not shown) to test and reject (P<0.001) the null hypothesis that severities of cartilage and OP neuromast phenotypes vary independently from one another in individual arches.
↵* In three cases, the M2 neuromast was duplicated, resulting in a total of 47.
↵** In one case, no M2 neuromasts were present; in five cases the M2 neuromast was duplicated, resulting in a grand total of 39.
↵*** In seven cases, no M2 neuromasts were present; in ten cases the M2 neuromast was duplicated, resulting in a grand total of 89.

