Fig. 5
Fig. 5
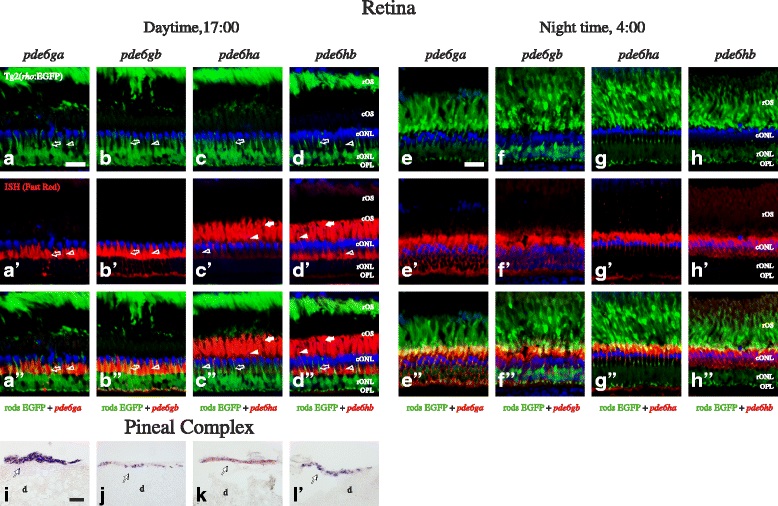
Expression pattern of the PDE6 inhibitory subunit genes in the adult zebrafish retina and pineal complex. Photomicrographs from ISH experiments on adult Tg2(rho:EGFP) zebrafish showing staining for pde6ga, pde6bg, pde6ha and pde6hb in the retina at 17:00 PM (a-d′′) and at 4:00 AM (e-h′′), and also in the pineal complex (i-l). The upper row shows EFGP fluorescence (green) in rods (a-h), the second row from the top shows the ISH experiments stained with Fast Red (red), (a′-h′), the second from the bottom is a merge of the two previous (a′′-h′′) and the bottom row shows ISH stained with NBT/BCIP (i-l). DAPI, in blue, stains cell nuclei in all fluorescent photomicrographs. Stricken morphological differences, due to the retinomotor movements, can be observed in the retina between day and night, graphically represented by the contraction of the rOS from the outermost layer at daytime (a-d) to inner locations at night (e-h). This makes very difficult the cell assignment in the night retinae, so it was shown only in the day retinae (a-d′′). Staining for pde6ga (a′-a′′ and e′-e′′) and pde6gb (b′-b′′ and f′-f′′) can be observed in rod inner segments and for pde6ha (c′-c′′ and g′-g′′) and pde6hb (d′-d′′ and h′-h′′) in cones. Staining for all four genes was observed in adult pineal complex (i-l). In a′-a′′ and b′-b′′, staining in the SSC seems to be present, therefore, we cannot discard that pde6ga and pde6gb are expressed in rods and SSC. In addition, the yellowish colour observed in 5g′′ could suggest double staining; however its absence in the day retina, combined with the about 100 fold lower expression levels and the loose morphology of the night retinae led us to conclude that this is just an artefact. Abbreviations: d; diencephalon, cONL; cone outer nuclear layer, cOS; cone outer segments, OPL; outer plexiform layer, rONL; rod outer nuclear layer, rOS; rod outer segments. Arrows point at DC, arrowheads to LSC, empty arrowheads to SSC and empty arrows to rods′ myoids. In i-l, arrows point at the pineal complex. Scale bars; in a is 20 µm for a-d′′, in e is 20 µm for e-h′′ and in i is 30 µm for i-l

