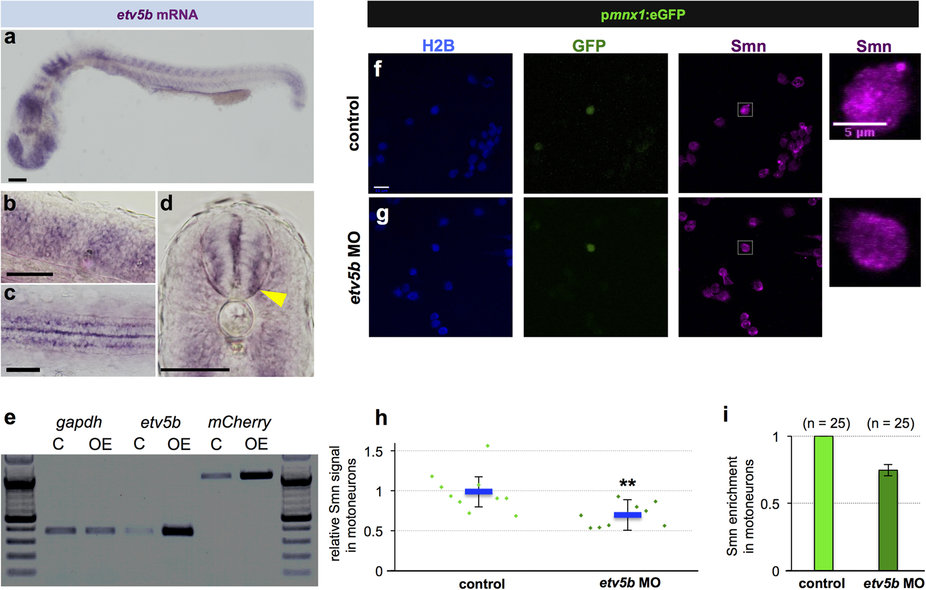
Fig. 3
Etv5b activates the smn promoter leading to increased Smn levels in motoneurons. (a-d) Whole-mount in situ hybridization of etv5b expression in 24 hpf embryos. Expression pattern in the entire embryo (a), in magnified lateral (b) and dorsal (c) views as well as in a transverse section (d) of the trunk. In the latter case, yellow arrowhead denote signal in the motoneuron region. Scale bars: 100 µm (a) and 50 µm (b-d). nc, notochord. (e) RT-PCR in control (C - only psmn:mCherry) versus etv5b overexpressing (OE - etv5b mRNA and psmn:mCherry) embryos at early gastrula stage. (f,g) scIF of control (f) and etv5b MO (g) cells from pmnx1:eGFP embryos. H2B, GFP and Smn signals are shown in Z-projected confocal sections. GFP+ cells marked by white rectangles are magnified on the right. Scale bars: 10 µm for low and 5 µm for high magnification. (h) Relative Smn signal in control and in etv5b MO cells from one representative experiment. Exact values are (mean ± SD): 0.99 ± 0.25 (control) and 0.7 ± 0.14 (etvb5 MO), p = 0.003 with Wilcoxon Sum Rank Test. (i) Average relative Smn levels in control and in etv5b MO motoneurons. The exact value of decrease is 0.75 ± 0.04 (mean ± SD). N = 3 experiments, n = number of analyzed cells.

