Image
Figure Caption
Fig. S4
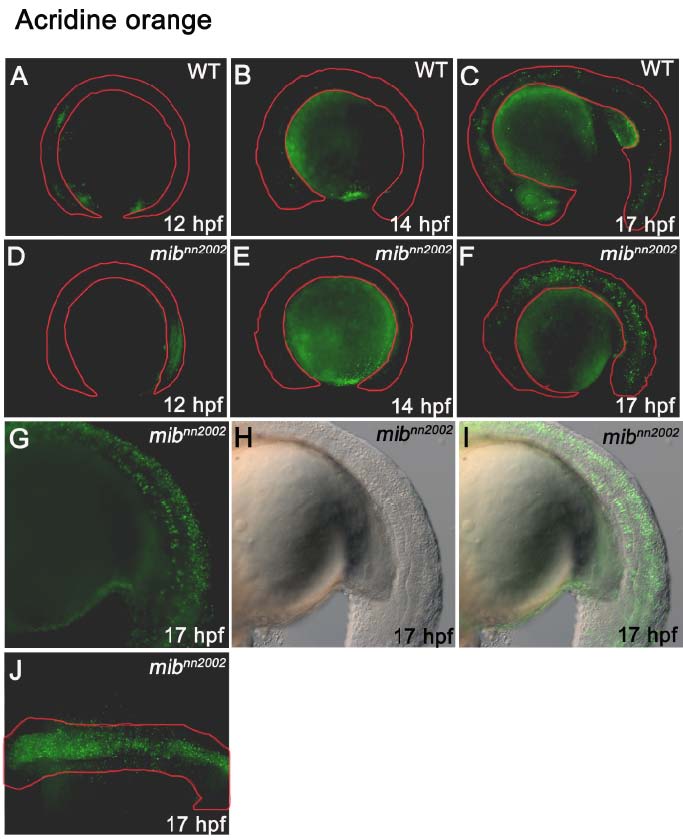
Cell death in mibnn2002 mutants. All the embryos are treated with acridine orange. A-C are wt embryos; D-J are mibnn2002 homozygotes. A and D are at 12 hpf; B and E are at 14 hpf; C and F-J are at 17 hpf. A-I are lateral views with head toward left; J is dorsal view with head toward left. The contours of embryos are outlined by the red lines. (F) The amount of cell death is highly increased in 17 hpf mibnn2002 homozygotes. Cell death was mainly located around (G-I) neural tube and notochord.
Figure Data
Acknowledgments
This image is the copyrighted work of the attributed author or publisher, and
ZFIN has permission only to display this image to its users.
Additional permissions should be obtained from the applicable author or publisher of the image.
Full text @ Sci. Rep.

