
|
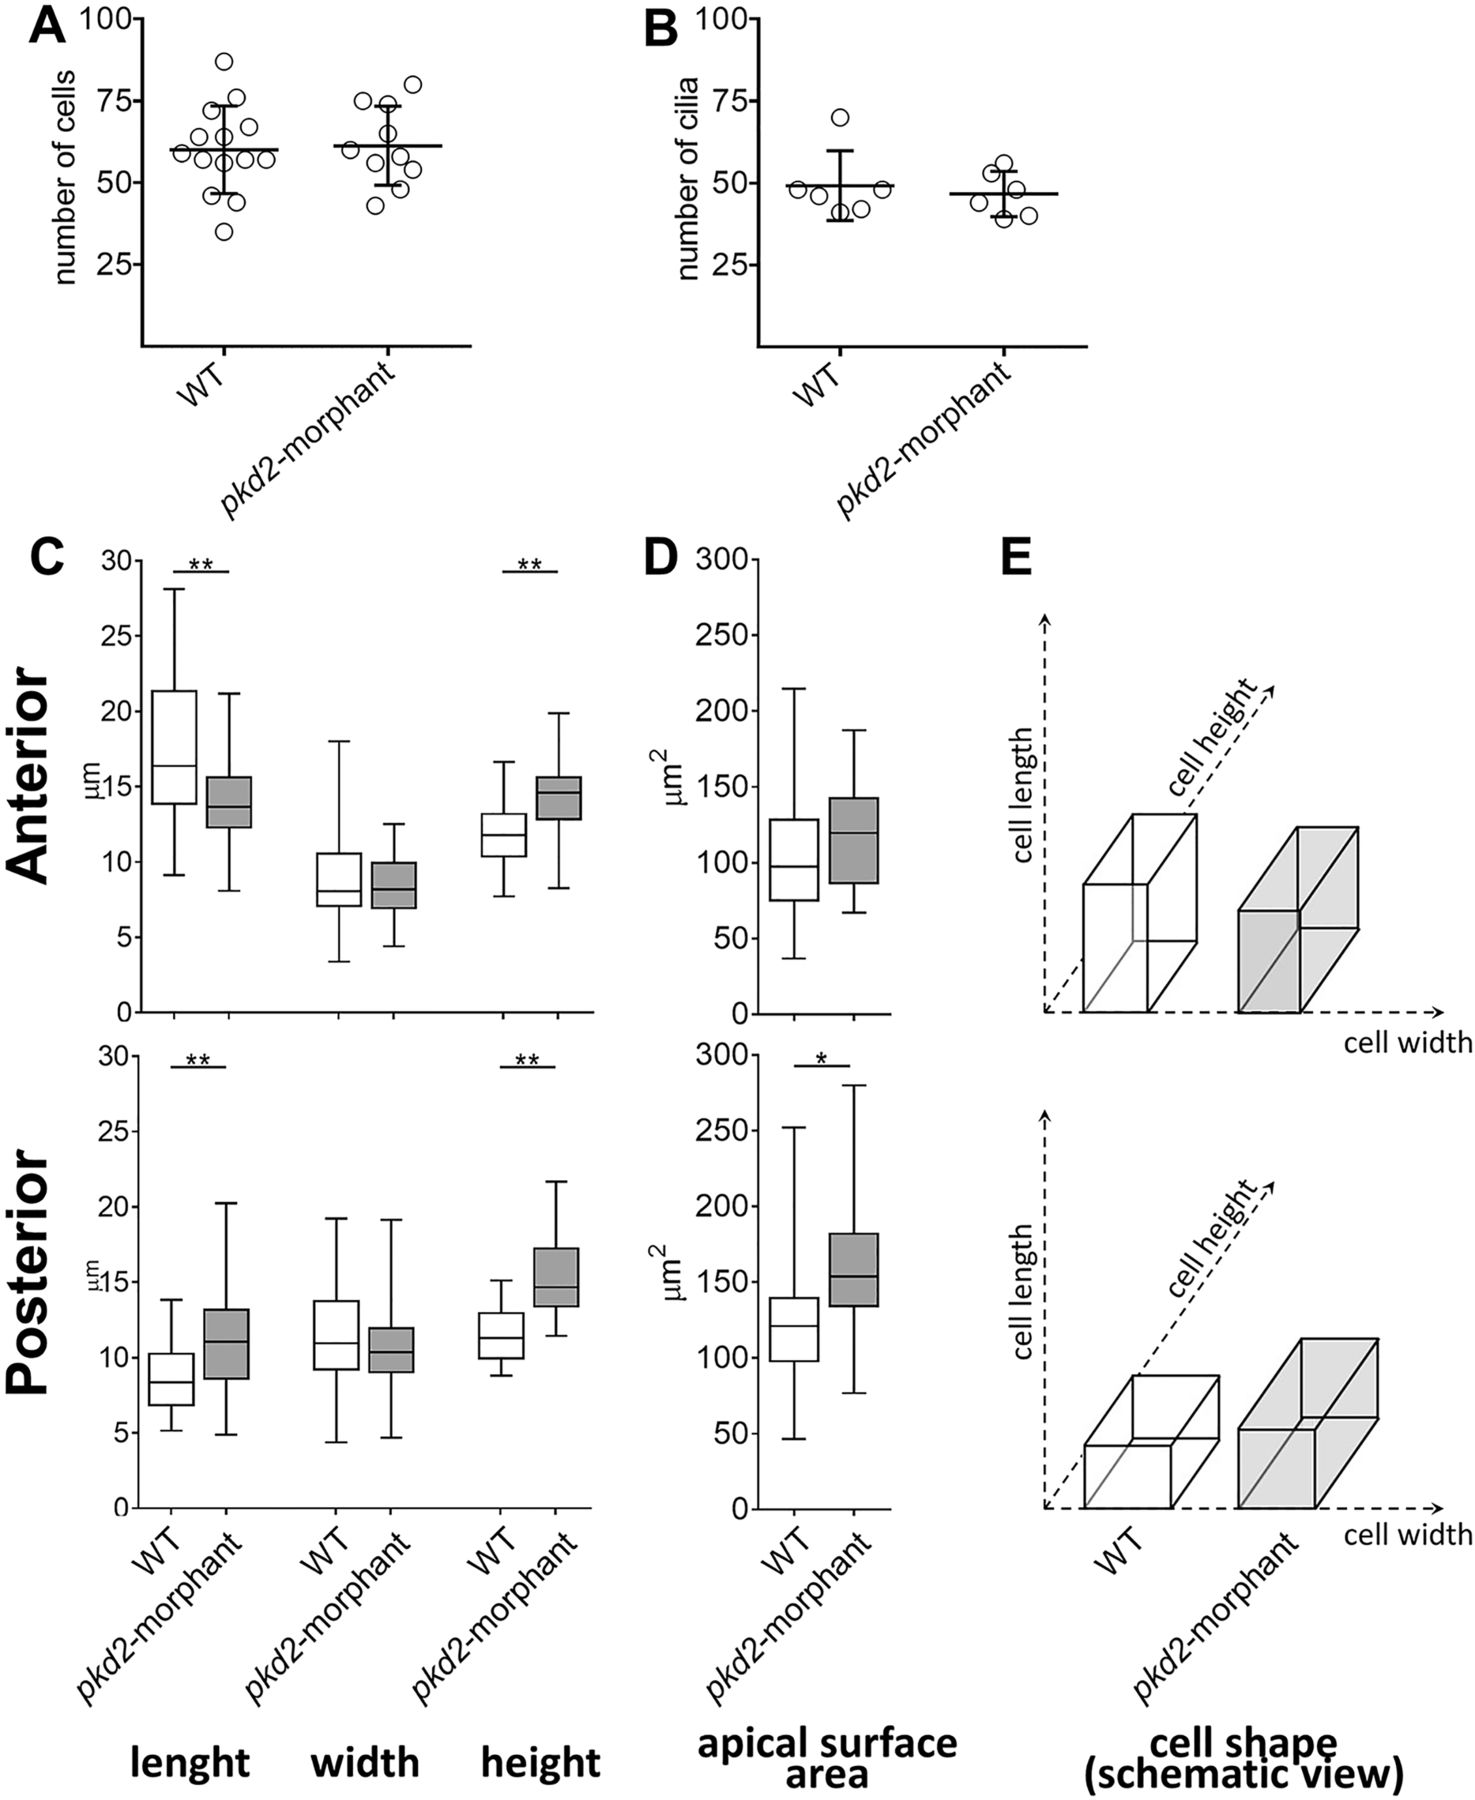
Fig. 3 KV-lining cells. (A) Number of cells counted in the whole KV live-microscopy scans of 10–11s.s. WT (n=14) and pkd2-morphant (n=10) embryos. (B) Number of cilia counted in WT (n=6) and pkd2-morphant (n=6) embryos immunodetected for acetylated α-tubulin. (C) Cellular length, width and height of WT (n=6) and pkd2-morphant (n=11) embryos immunodetected for actin cytoskeleton. The box plot and the respective max and min values are indicated. *P<0.01 and **P<0.0001, significantly different from WT. (D) Estimated apical surface area of KV-lining cells. (E) Schematic representation of cell shape of WT and pkd2-morphant KVs.