Fig. 3
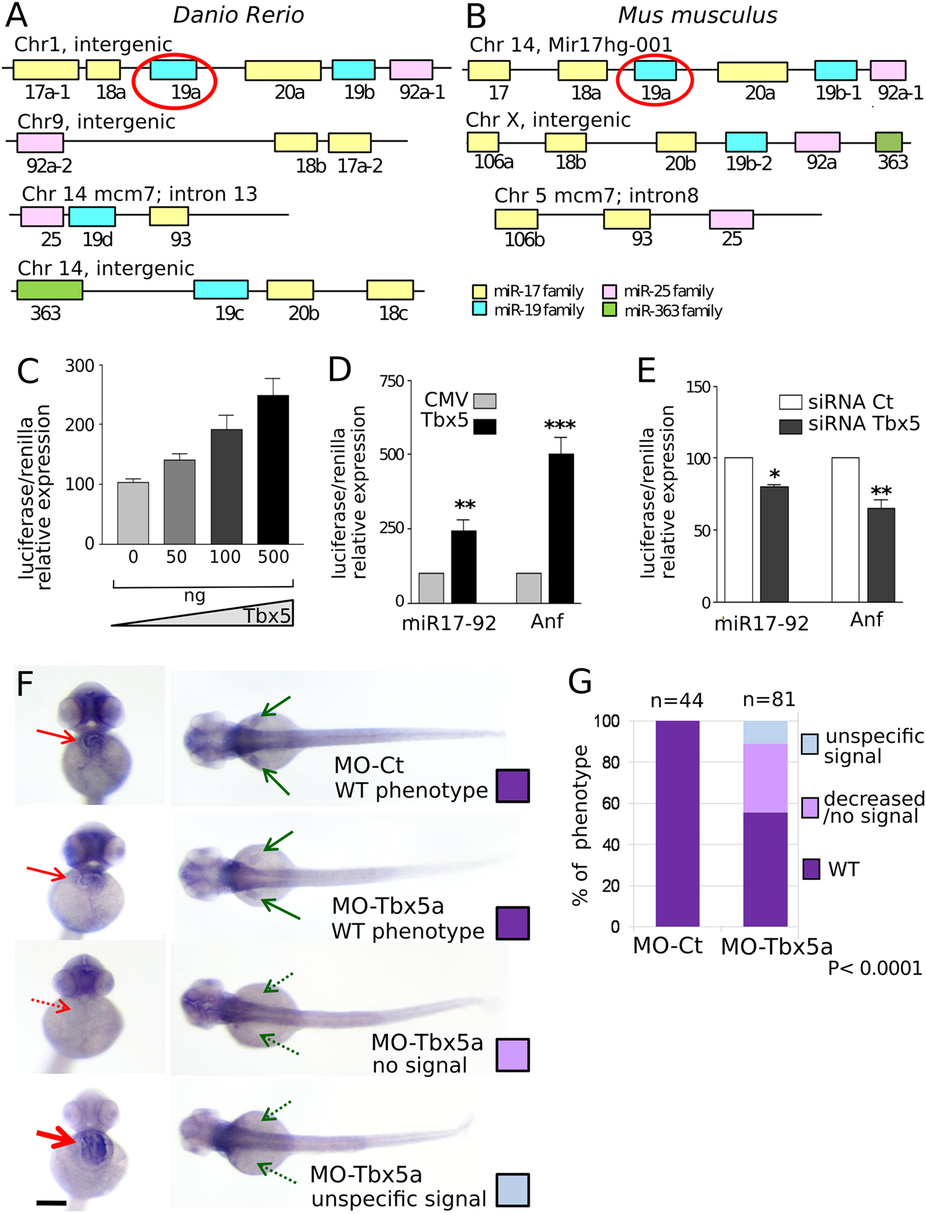
Tbx5 modulation affects miR-17-92 cluster expression.
(A,B) Schematic representation of miR-17-92 paralogs in zebrafish and mouse. The color code identifies miRNAs of the same family. (C) Relative Luciferase/Renilla activity in HL1 cells transfected with pGL3-MIR (containing a fragment of 1600 bp of miR-17-92 cluster promoter upstream of the luciferase reporter gene) and the pRL-TK renilla vector in the presence of increasing doses (0–500 ng) of pCMV-Tbx5 vector; (D,E) Relative Luciferase/Renilla activity in HL1 cells transfected with 500 ng of pGL3-MIR or 500 ng of pGL3 vector containing the Anf promoter (Anf) in the presence of (D) 500 ng of CMV-Tbx5 or the empty CMV vector; (E) Tbx5 specific siRNA (siRNA-Tbx5) or nonspecific siRNA (siRNA Ct). The y-axis represents fold activation of reporter normalized by a dual-luciferase system. t-test was used for statistical analysis *P < 0.05. (F) miR-17-92 cluster ISH on 72 hpf embryos injected with 1.5 ng of MO-Ct or 1.5 ng of MO-Tbx5a. Examples of the different phenotypes observed in the Tbx5 morphants are shown. Red and green arrows indicate heart and fins, respectively. Dashed arrows highlight the absence of expression, thicker arrow indicates over-expression. Scale bar 100 µm. (G) Quantification of the different phenotypes as in (F). A color code is used to identify the different phenotypes: only the WT (purple) phenotype is present in embryos injected with MO-Ct (upper panel of 3F), while 3 different phenotypes are recognizable in embryos injected with MO-Tbx5a. Fisher’s test P value is reported. n, numbers of embryos analyzed.

