
Image
|
Figure Caption
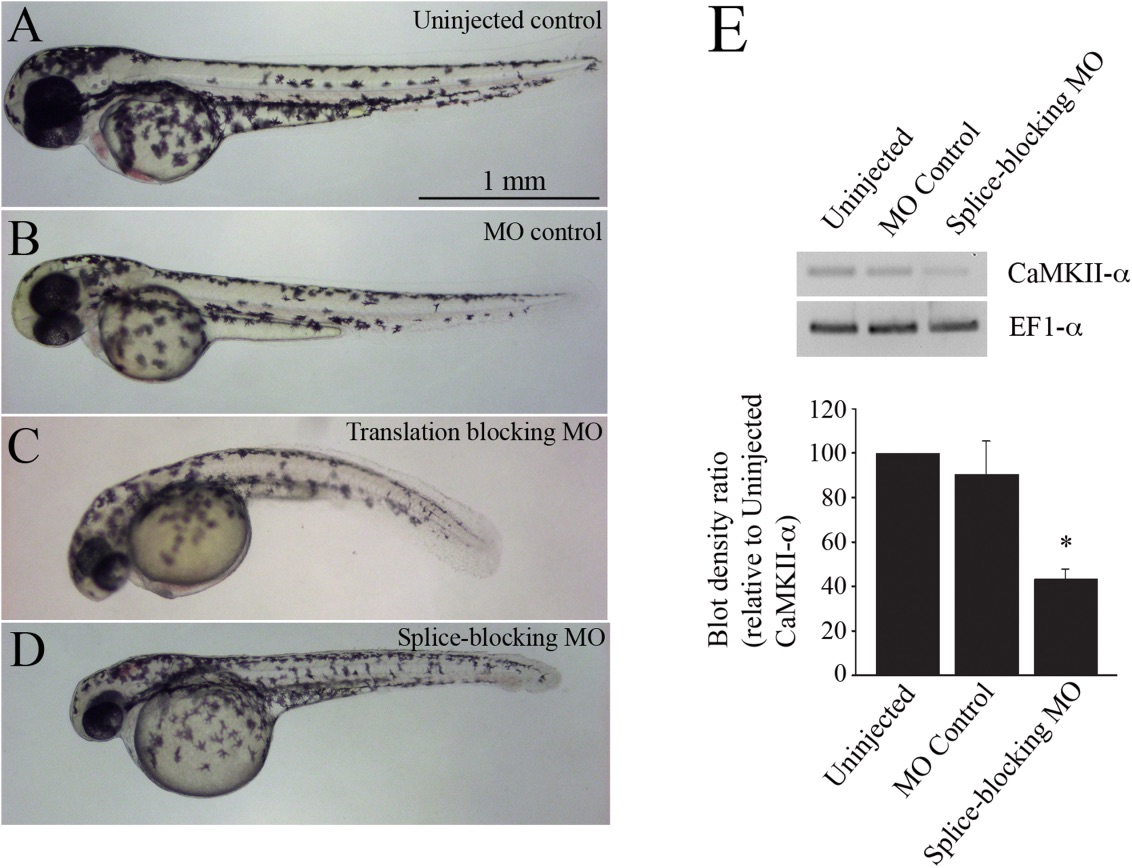
Fig. 3 Images of 2 dpf zebrafish. (A) uninjected controls, (B) embryos injected with 4 ng of control morpholino, (C) embryos injected with 4 ng of a translation-blocking CaMKII-α morpholino, and (D) embryos injected with 4 ng of a splice-blocking morpholino. (E) RT-PCR blots of CaMKII-α knockdown assessment. EF1-α was used as a loading control. Quantification of blot densities (n = 5 experiments).
Figure Data
Acknowledgments
This image is the copyrighted work of the attributed author or publisher, and
ZFIN has permission only to display this image to its users.
Additional permissions should be obtained from the applicable author or publisher of the image.
Full text @ Dev. Neurobiol.