Fig. S8
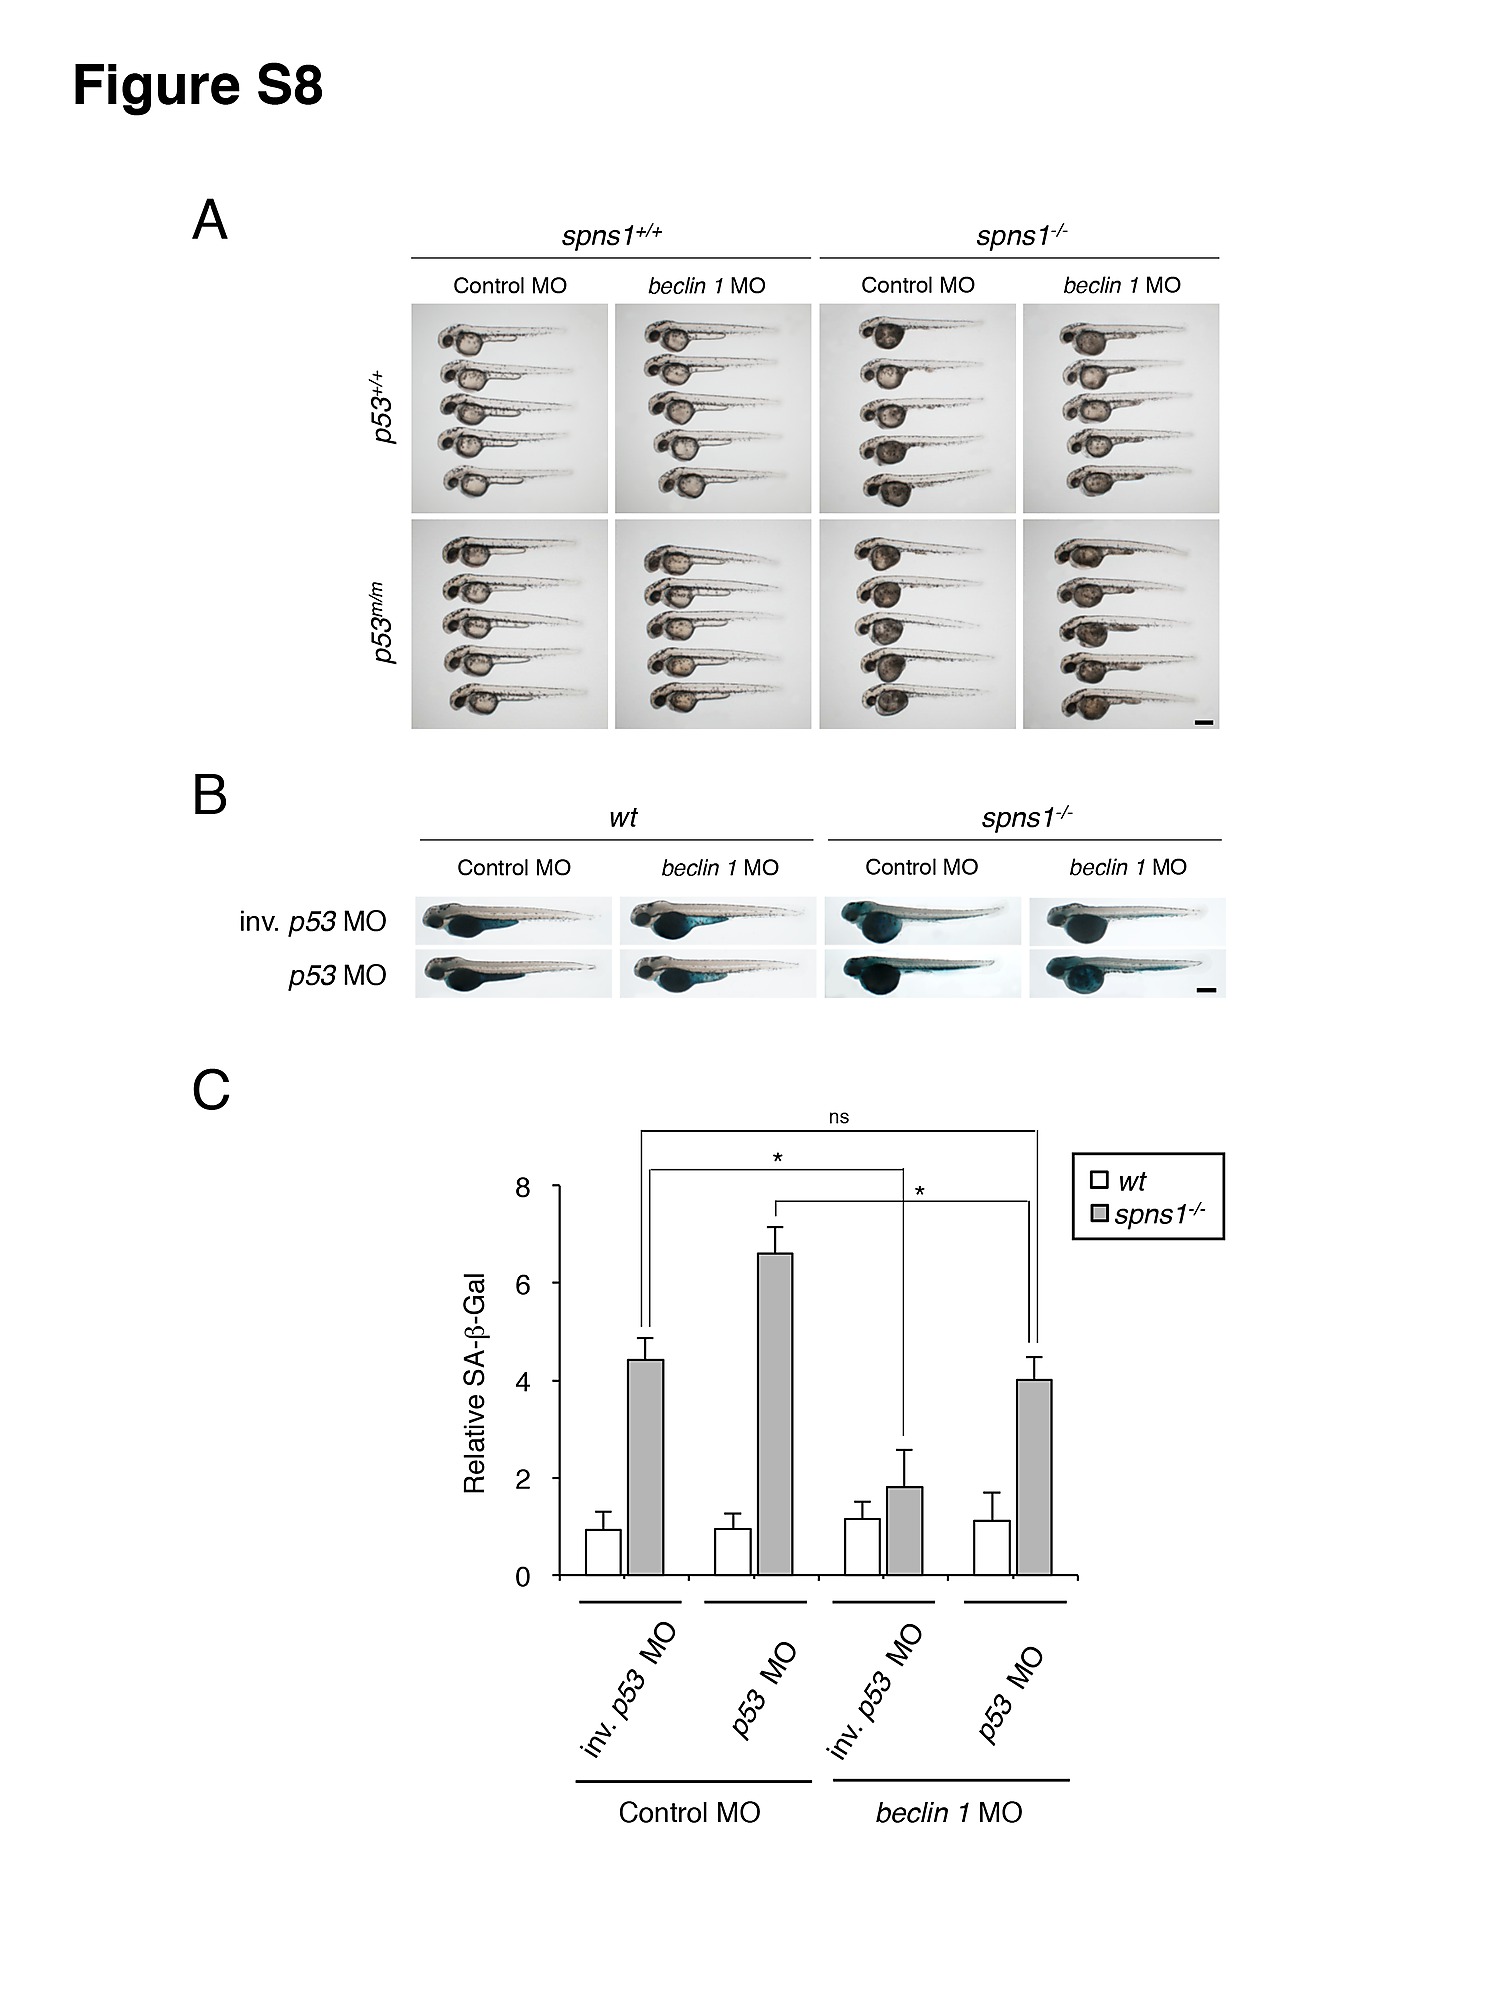
Impact of Beclin 1 depletion on Spns1 deficiency in the presence or absence of p53. (A) Yolk opaque phenotype of control MO-injected or beclin 1 MO-injected wild-type (spns1+/+;tp53+/+), tp53zdf1/zdf1 (tp53m/m), spns1hi891/hi891 (spns1-/-), and spns1hi891/hi891;tp53zdf1/zdf1 (spns1-/-;tp53m/m) animals is compared at 48 hpf. Opacity is greater in the p53 mutant background with Spns1 deficiency. The attenuated suppressive effect of beclin 1 MO (12 ng/embryo) yolk opacity in spns1hi891/hi891;tp53zdf1/zdf1 animals is shown. Scale bar, 250 μm. (B) spns1hi891/hi891 animals coinjected with beclin 1 MO and p53 MO or beclin 1 MO and inverse-sequence p53 MO (inv. p53 MO; negative control) were assayed for the SA-β-gal detection at 84 hpf. The beclin 1 MO-mediated suppression of SA-β-gal in spns1hi891/hi891 animals was attenuated by p53 MO injection. Scale bar, 250 μm. (C) Quantification of the SAβ-gal intensities shown in (B). Quantification of data presented in panel B (n = 10) is shown in the right graph; the number (n) of animals is for each morphant. Error bars represent the mean ± S.D., *p<0.005; ns, not significant.

