Fig. 5
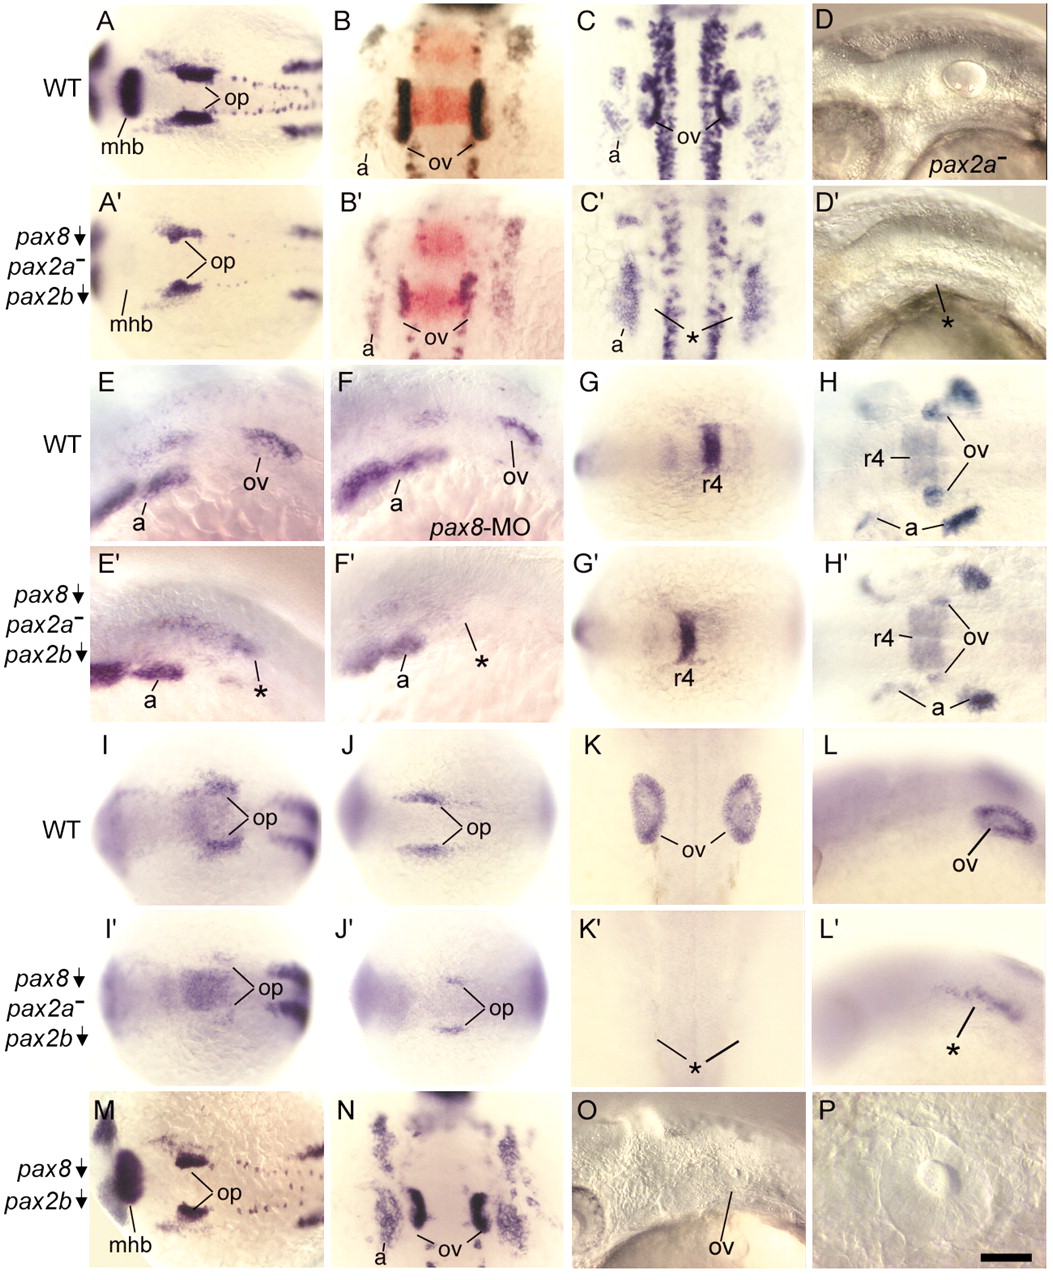
Fig. 5 Relative functions of pax8, pax2a and pax2b. (A-C) pax2a expression in wild-type embryos at 14 hpf (A), 18 hpf (B) and 24 hpf (C). (D) Head region of an uninjected noi (pax2a) mutant at 30 hpf. The otic vesicle has essentially normal morphology. A2-D2, noi (pax2a) mutants co-injected with pax8-MO and pax2b-MO showing pax2a expression at 14 hpf (A2), 18 hpf (B2) and 24 hpf (C2), and a live specimen with no otic vesicles at 30 hpf (D2). krox20 expression in the hindbrain is shown in red (B,B2). (E,E2,F,F2) dlx3b expression at 24 hpf in a wild-type embryo (E), a wild-type embryo injected with pax8-MO (F), and noi (pax2a) mutants co-injected with pax8-MO and pax2b-MO (E2,F2). The specimen in E2 lacks morphological otic vesicles but does show a scattering of dlx3b-expressing cells in the otic region (asterisk). The specimen in F2 lacks morphological signs of otic development and also shows no dlx3b expression in the otic region (asterisk). G,G2,H,H2, fgf3 expression in wild-type embryos at 14 hpf (G) and 19 hpf (H) and in pax2ba-pax2b-pax8-deficient embryos at 14 hpf (G2) and 19 hpf (H2). Expression in the hindbrain (r4) is normal in all specimens, whereas expression in the otic vesicle (ov) is strongly reduced at 19 hpf in pax2a-pax2b-pax8-deficient embryos (compare H,H2). (I,I2) sox9a expression at 13.5 hpf in wild-type (I) and pax2a-pax2b-pax8-deficient (I2) embryos. (J-L,J2-L2) claudinA expression in wild-type embryos at 13.5 hpf (J) and 24 hpf (K,L), and in pax2a-pax2b-pax8-deficient embryos at 13.5 hpf (J2) and 24 hpf (K2,L2). M-P, wild-type embryos co-injected with pax8-MO and pax2b-MO showing expression of pax2a at 14 hpf (M) and 18 hpf (N), the head region of a live specimen with a small otic vesicle at 30 hpf (O), and an enlargement of the otic vesicle of the same specimen (P). Images show dorsal views with anterior to the left (A,A2G-J,G2-J2,M), dorsal views with anterior to the top (B,B2,C,C2,K,K2,N), or lateral views with anterior to the left (D-F,D2-F2,L,L2,O,P). a, pharyngeal arches; asterisk, region where otic vesicle normally forms; mhb, midbrain-hindbrain border; op, otic placode; ov, otic vesicle; r4, rhombomere 4 of the hindbrain. Scale bar in P: 170 μm for A,A2,G,G2,I,J,I2,J2,M; 75 μm for B-F,B2-F2,H,H2,K,L,K2,L2,N,O; 19 μm for P.

