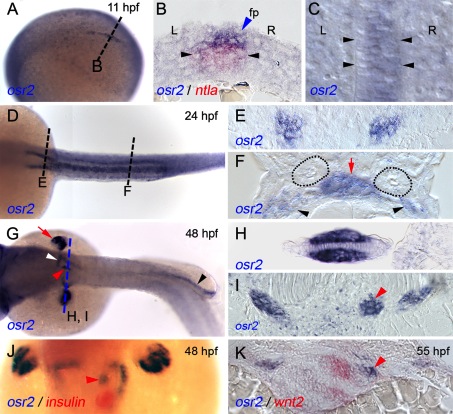
Fig. 1 osr2 expression during zebrafish development. A: At 11 hpf, osr2 is expressed in the posterior embryonic midline (tilted lateral view, anterior to the left). B: Cross-section of an 11-hpf embryo at the level of the dotted line indicated in A showing osr2 (blue arrowhead) expression in floorplate (fp) cells overlying the notochord marked by red ntl expression (black arrowheads). C: Expression of osr2 is biased to cells on the right side of the forming floorplate. Black arrowheads mark the boundaries of the notochord. L, left; R, right. D: At 24 hpf, osr2 is expressed in the pronephric proximal tubule and gut. E, F: Cross-section of 24 hpf embryo indicated in Figure 1D showing osr2 expression in the proximal pronephros (E) and gut (F; red arrow). Distal tubules of the pronephros do not express osr2 (dotted circles). osr2 expression is also observed in mesenchyme cells (black arrowheads) ventral and lateral to the pronephros. G: At 48 hpf, osr2 is expressed in fin (red arrow), pronephric proximal tubule (white arrowhead), posterior gut (black arrowhead), and in gut mesenchyme (red arrowhead) at the level for the pectoral fin. H, I: Cross-section of the embryo in G at the level indicated showing expression of osr2 in pectoral fin mesenchyme (H) pronephric tubules, and gut mesenchyme (I; red arrowhead). J: Double in situ hybridization showing gut mesenchyme (red arrowhead) expressing osr2 (blue) anterior to the exocrine pancreas as indicated by insulin (red) expression at 48 hpf. K: Gut mesenchyme (red arrowhead) expressing osr2 (blue) was adjacent to the pneumatic duct as indicated by wnt2 (red) expression at 55 hpf.
Image
Figure Caption
Figure Data
Acknowledgments
This image is the copyrighted work of the attributed author or publisher, and
ZFIN has permission only to display this image to its users.
Additional permissions should be obtained from the applicable author or publisher of the image.
Full text @ Dev. Dyn.

