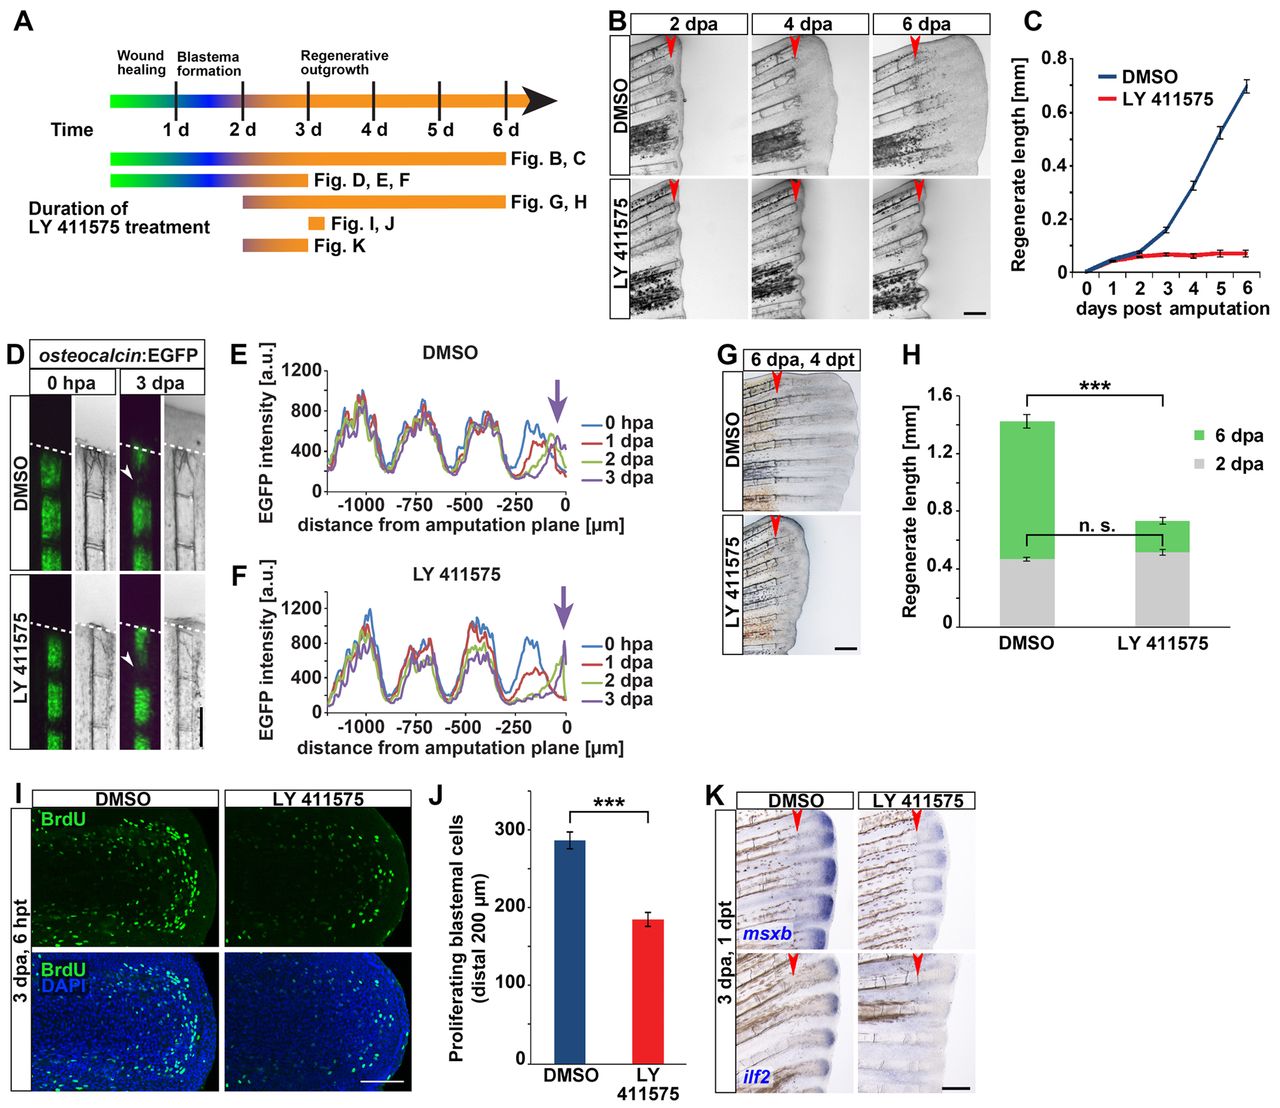
Fig. 3 Notch signaling is necessary for fin regeneration. (A) Schematic timeline of fin regeneration and experimental treatments. (B) Fins treated with LY411575 starting from the time of amputation fail to regenerate. (C) Regenerate length of fins treated with DMSO or LY411575 from the time of amputation, mean±s.e.m., n=6 fish, 18 fin rays each group (LY at day 6: n=5 fish, 15 fin rays). At all timepoints, except 1 and 2 dpa, regenerate lengths are significantly different (P<0.001) in control and LY411575-treated fins, Student’s t-test. (D) LY411575 treatment from the time of amputation does not affect downregulation of EGFP expression (arrowhead) in the distalmost stump segment of osteocalcin:EGFP transgenic fins. Dashed line indicates amputation plane. (E,F) EGFP pixel intensity plots of representative osteocalcin:EGFP transgenic fin rays at the indicated time points after amputation treated with DMSO (E) or LY411575 (F), showing a decrease in intensity in a region 250 μm proximal to the amputation plane (0 on x-axis, right) and a shift of intensity towards the amputation plane (arrow). (G) Treatment with LY411575 for 4 days starting from 2 dpa is sufficient to interfere with regenerative outgrowth. (H) Regenerate length of fins treated as those in G at 2 dpa (prior to the start of treatment) and at 6 dpa, 4 days after the start of treatment (dpt). Mean±s.e.m. n=6 fins, 18 fin rays. ***P<0.001. (I) Confocal images of anti-BrdU immunofluorescence in the mesenchymal compartment of fin rays at 3 dpa treated with DMSO or LY411575 for 6 hours. (J) Number of BrdU-positive cells in the distal 200 μm of the mesenchyme of fins treated as in I. Mean±s.e.m. DMSO: n=7 fish, 27 blastemas; LY 411575: n=7 fish, 26 blastemas. ***P<0.001. (K) The blastema markers msxb (6/6 fins) and ilf2 (5/6 fins) are downregulated in regenerates treated with LY411575 for 24 hours starting at 2 dpa. (B-K) Red arrowheads indicate amputation plane. Scale bars: 200 μm in B,D,G,K; 100 μm in I.
Image
Figure Caption
Figure Data
Acknowledgments
This image is the copyrighted work of the attributed author or publisher, and
ZFIN has permission only to display this image to its users.
Additional permissions should be obtained from the applicable author or publisher of the image.
Full text @ Development

